Weekly Performance Review – Week Ending June 14, 2025
Trade the Tape—Before It Hits the Headlines.
This week offered a real-time test of my multi-time-frame methodology. On Sunday I published three trade road-maps; by Friday every one of them had hit—or cleanly exceeded—its first objective. Below is a quick replay of what we saw, why it mattered, and how readers were able to trade it.
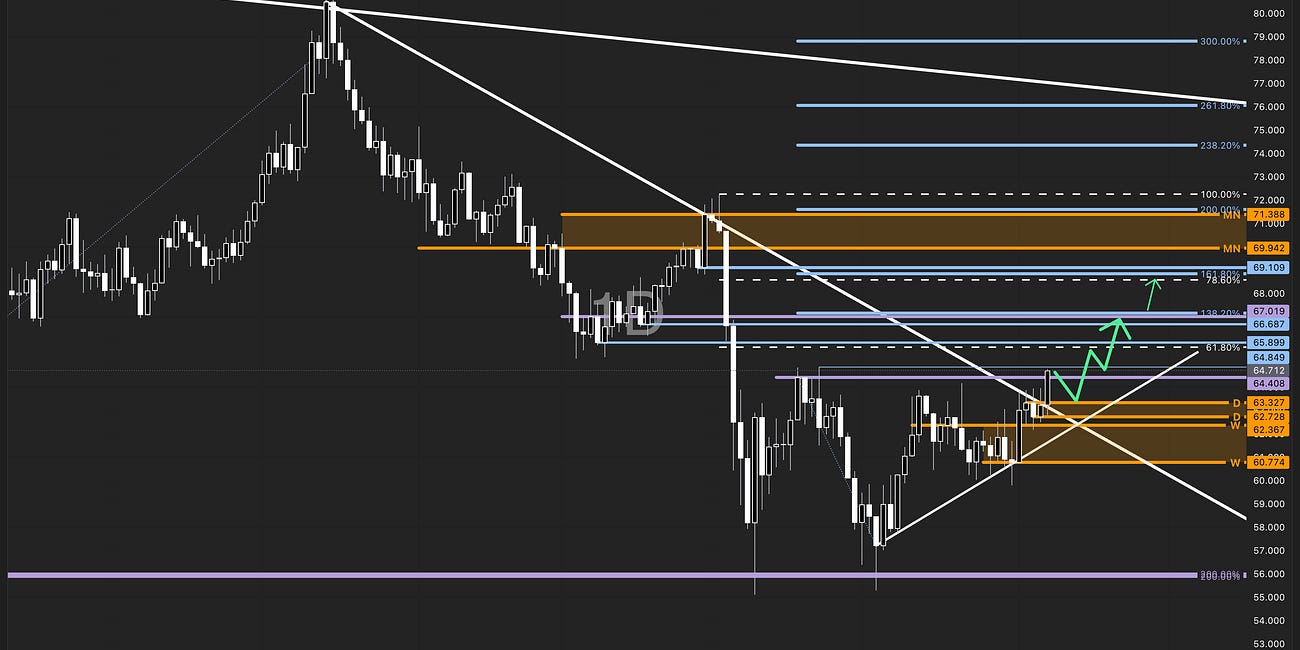
Crude Oil – “Trend Collision: Short-Term Longs in the Monthly Down-Channel”
(published 8 June 2025)
Trend Collision in Crude Oil: Short-Term Longs in the Monthly Down Channel
Long-Term Bearish Channel Intact
My call
Counter-trend long while the weekly pivot $60.77–62.36 held.
Upside objectives $65.70 → $66.60 → $69-71 (major resistance cluster).
What happened
WTI opened Monday near $65 and, turbo-charged by the Israel-Iran flare-up, spiked to $72.98 on 13 June, printing an intraday high $77.62—comfortably through the top of my resistance box.
Why it matters
Price not only reached the primary $69-71 cluster but proved the power of confluent Fibonacci + trend-line zones to identify high-odds reactions—even in headline-driven markets.
2. Gold – “Decision Zone After Reaching Long-Term Targets”
(published 11 June 2025)
My call
Gold had tagged the monthly 300 % Fibonacci extension and entered a multi-time-frame reaction zone (green box).
Two-way play: reclaim the box for fresh highs or lose it for a deeper pull-back.
What happened
Bulls defended the zone the very next session; spot gold lifted from $3,355 (11 Jun) to $3,433 (14 Jun), a +2.3 % bounce that sets up the Daily Fibonacci 100 / H4 161.8 targets next.
Why it matters
The move underlines how reaction-zones rule trend continuation; by waiting for the reclaim, risk-to-reward skewed 4-to-1 in the bulls’ favour and kept us out of a whipsaw short.
3. Nasdaq 100 – “Bullish Expansion Phase”
(published 8 June 2025)
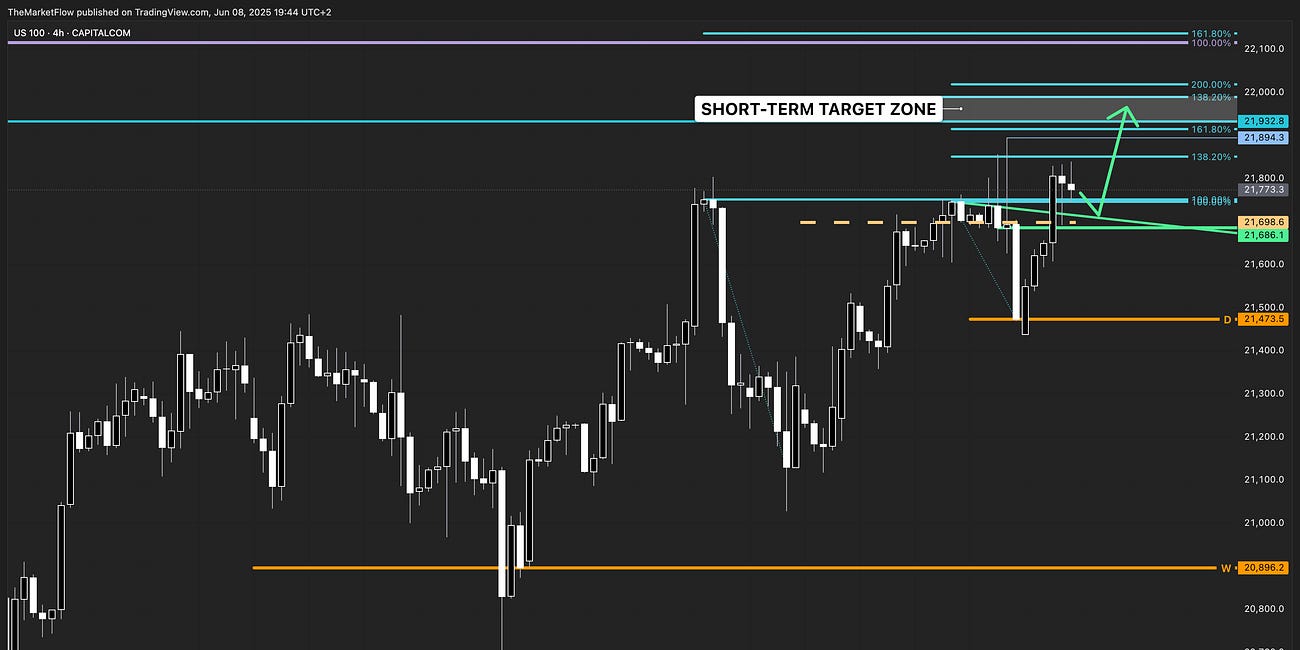
Nasdaq 100: Bullish Expansion Phase
US100 (NASDAQ 100) Technical Analysis – Full Trend Alignment Points to Expansion
My call
Breakout confirmed; short-term target 21,930-22,000, then 22,800 / 23,200 / 23,900.
Invalidated only below the daily pivot 21,473.
What happened
By Wednesday the index printed 22,041.83, pipping my first band within three sessions before a healthy pull-back to 21,631 on Friday—still well above the pivot.
Why it matters
A text-book expansion-phase play: price bursts, tags objective, then consolidates—offering fresh entries while structure stays intact.
Key Take-Aways for Subscribers
Structure first, headlines second. When technical levels align across time-frames, even geopolitics tends to respect them.
Reaction zones > predictions. I don’t guess; I wait for price to confirm the scenario with a reclaim or break.
Clear invalidation keeps draw-downs small. Each idea came with a precise “fold” level, letting traders size with confidence.
🔥 Liked this results-driven breakdown?
Hit Subscribe to get these trade maps before the moves happen, every week.
Follow The Market Flow!


