
Nasdaq 100: Bullish Expansion Phase
With trend structures in sync, the path of least resistance points higher—pivot zones now define the move.

US100 (NASDAQ 100) Technical Analysis – Full Trend Alignment Points to Expansion
June 8, 2025
Long-Term Outlook – Bullish Expansion Phase Validated
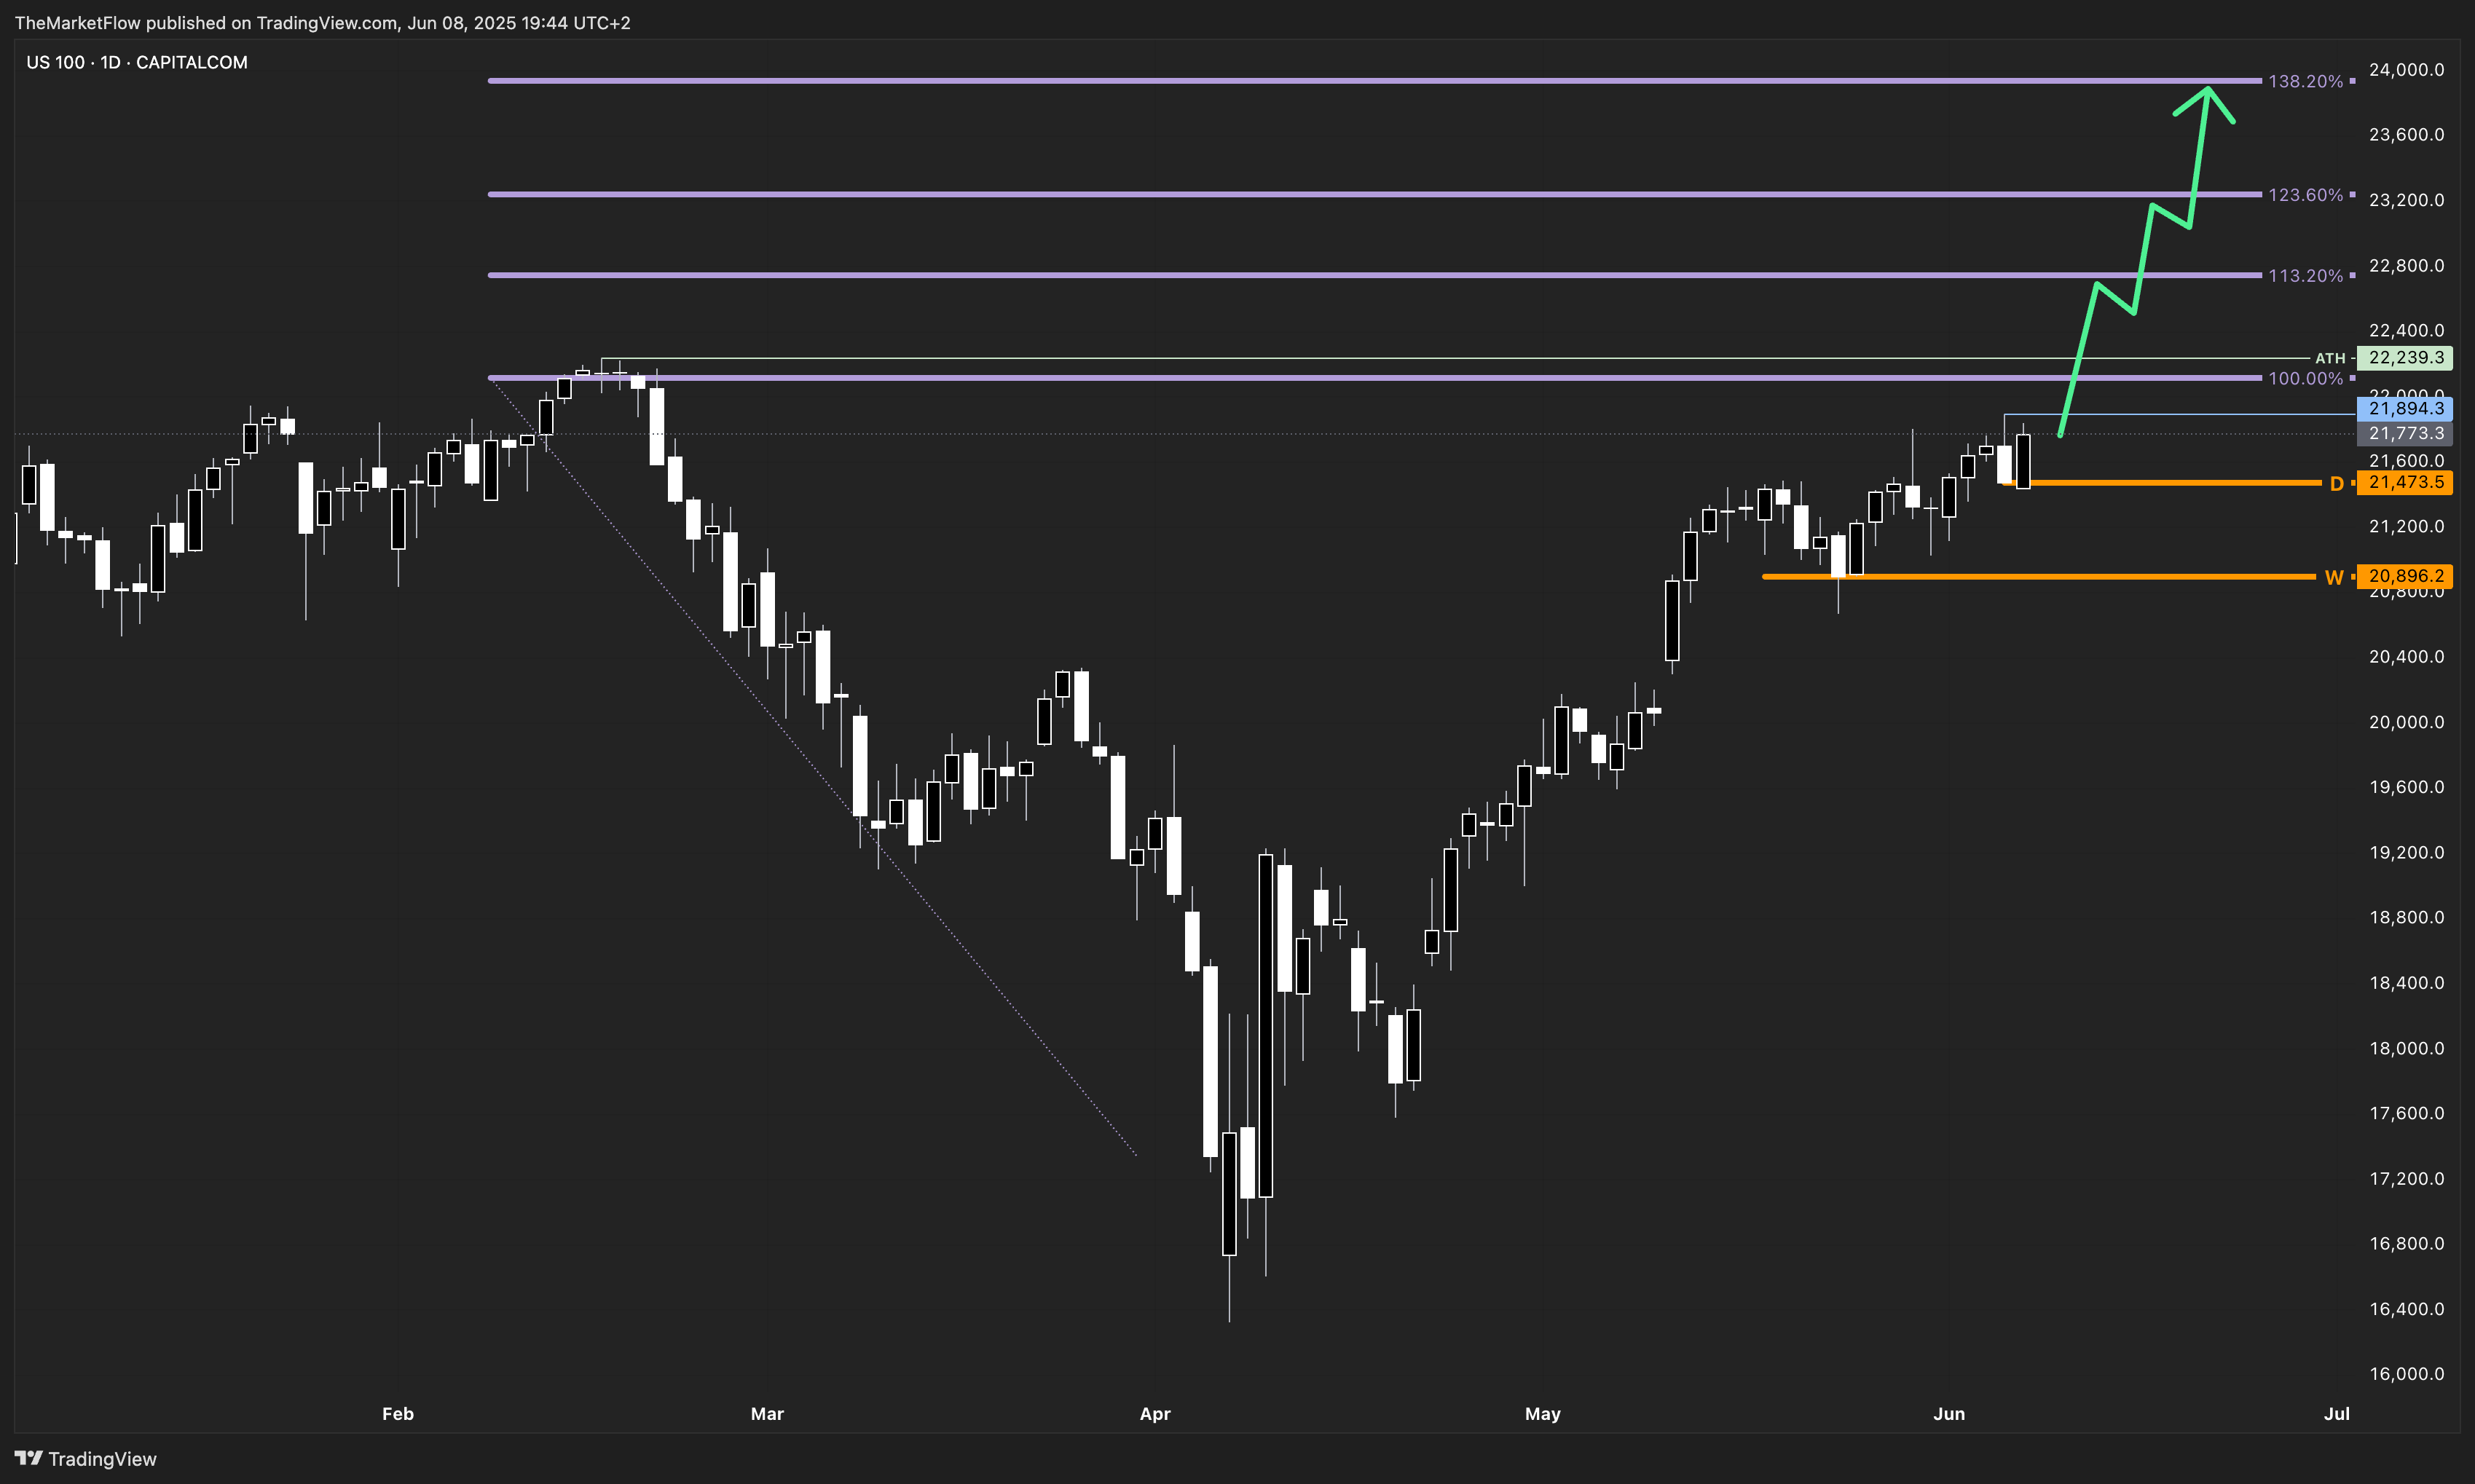
With Friday’s close, the Nasdaq 100 (US100) broke through the last clean weekly breakdown level. This move confirms the continuation of the long-term bullish trend and activates the weekly Fibonacci extension targets: 113.2% at approximately 22,800, 123.6% at 23,200, and 138.2% at 23,900.
This breakout marks a structural shift to the expansion phase. As long as the market remains above the weekly pivot zone near 20,896, these higher levels remain valid targets.

Daily Structure – Clear Trend, Clear Target
The daily trend remains in a confirmed long expansion phase, with price action progressing toward the previous weekly high and the all-time high (ATH) near 22,239. The daily pivot zone around 21,473 continues to act as a key support and validation level. A sustained move above this zone keeps the bullish structure intact.
Short-Term View – Impulse Confirmed, Monitoring Pullback
On the 4-hour chart, the market has broken both the countertrend line and the highest clean breakdown level with a strong impulse. This confirms the start of a potential expansion phase. Currently, the market is undergoing a short-term pullback, which is typical following a breakout.
If the price establishes a higher low and breaks short-term corrective structures on the lower timeframes (H1 and below), this could offer continuation setups in line with the dominant trend.

Key Reference Levels
The all-time high is located at 22,239. The daily pivot zone sits around 21,473, and the weekly pivot is near 20,896. Short-term targets are in the 21,930–22,000 range, while the weekly Fibonacci extensions point to 22,800, 23,200, and 23,900 as medium-term objectives.
Conclusion
The tech index is now in full multi-timeframe trend alignment, a condition that often precedes strong, sustained moves. The breakout above key resistance levels, supported by bullish structures on the weekly, daily, and H4 charts, suggests the path of least resistance is upward.
As long as the daily pivot zone holds, the expansion phase remains intact. Short-term corrections may provide high risk-to-reward opportunities for traders who remain aligned with the broader trend.