
Trend Collision in Crude Oil: Short-Term Longs in the Monthly Down Channel
Oil breaks out of its weekly countertrend with momentum—but trades into heavy resistance overhead.

Long-Term Bearish Channel Intact
On the monthly timeframe, Crude Oil continues to trade within a clearly defined downward channel, maintaining the long-term bearish trend. The lower boundary of this channel has recently been reached, providing technical support and triggering a corrective bounce.

Despite this reaction, the channel remains valid until broken, and the long-term trend continues to favor the downside.
However, the recent bullish price action suggests that buyers are defending the lower channel line aggressively, especially with confluence from the multi-year horizontal support zone around $64–60. This area has historically triggered significant reversals.
Double Fibonacci Target and Countertrend Validation on the Weekly
The weekly chart reveals a notable technical development. Price bounced from the 200% Fibonacci extension of two previous swings, creating a strong support base. This Fibonacci confluence marks a high-probability reaction zone. Following this, the market printed a strong bullish weekly wave structure that closed above the descending countertrend line, thereby validating a weekly bullish countertrend.

Currently, price trades between the key weekly pivot zone ($60.77–$62.36, orange zone) and multiple retracement levels up to $69.94–$71.38 (monthly pivot zone), which serve as overhead resistance.
As long as the weekly pivot zone remains intact, this countertrend may lead to further gains or at least continued sideways consolidation with a bullish tilt.
Breakout Confirmed but Facing Dense Overhead Structure on the Daily
On the daily chart, price has broken the short-term descending trendline, marking a clear breakout structure. The breakout came with a retest and continuation setup, supported by rising momentum.
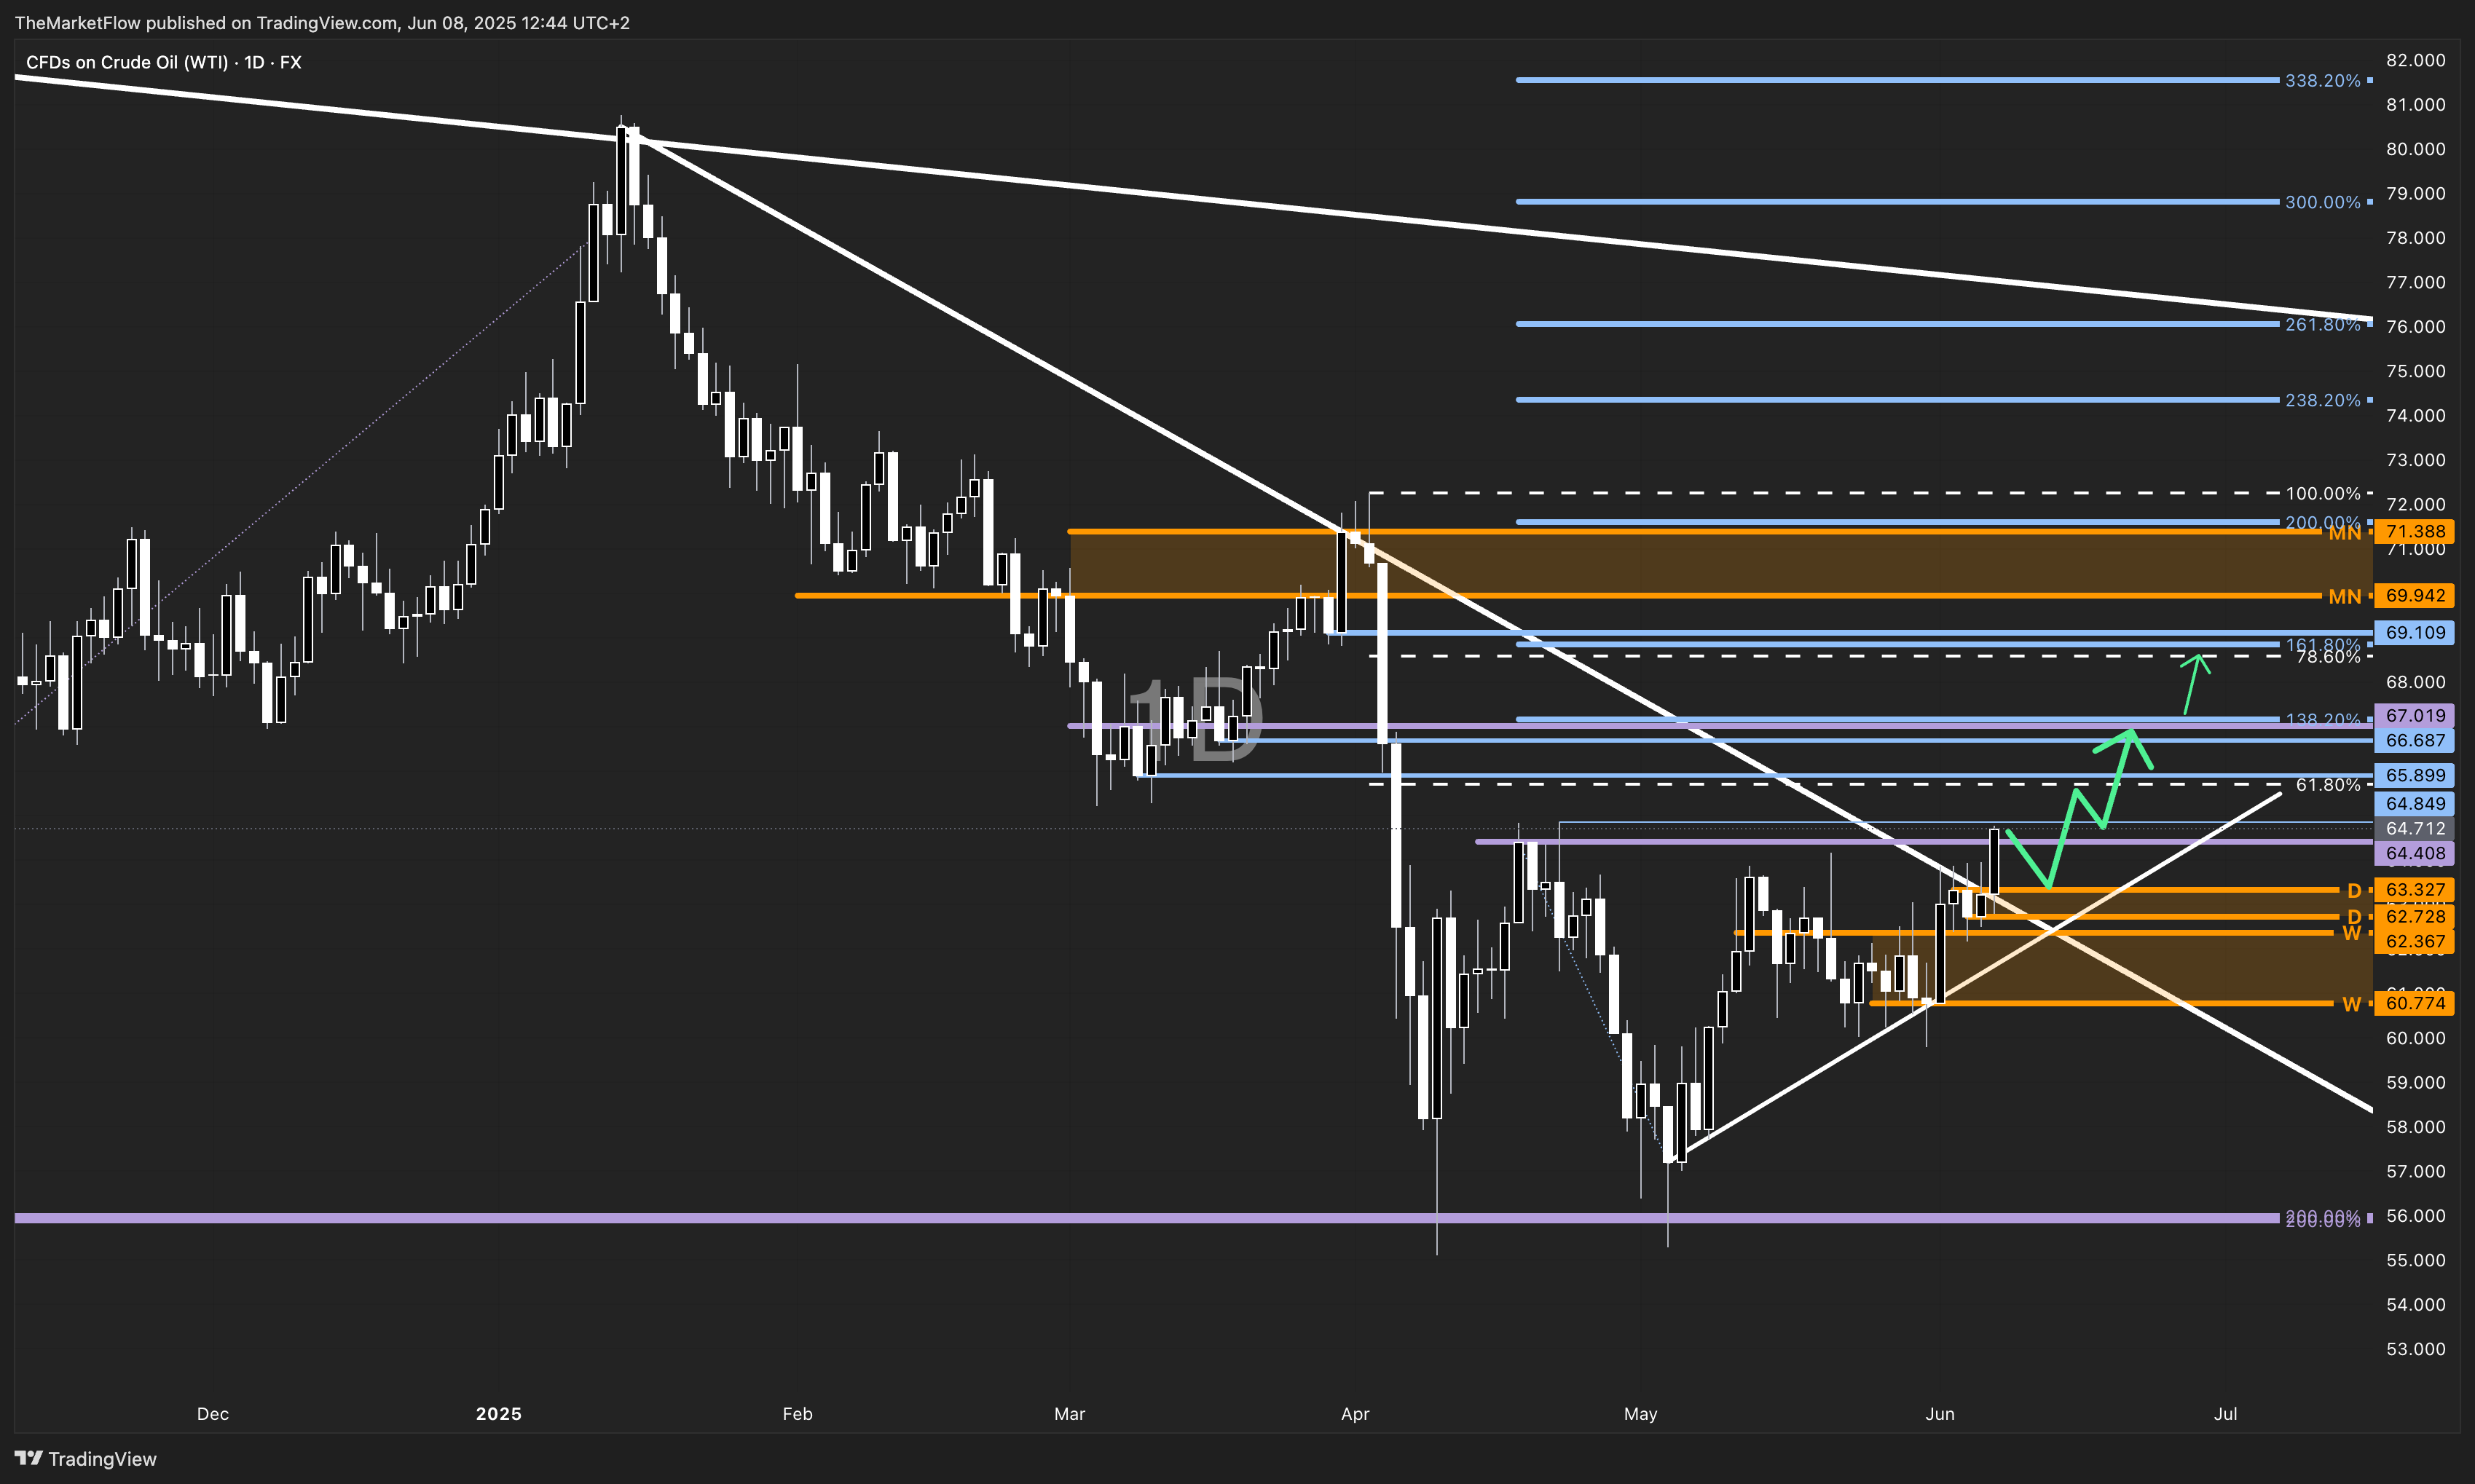
Despite this bullish pattern, the market is currently trading in a structurally dense correction zone — this includes the 50–61.8% retracement levels, previous daily breakdown levels, and one weekly breakdown zone. These overlapping resistances make this zone particularly tricky for clean continuation moves.
That said, if price can hold above the daily pivot zone (~$62.80-$63.30) and maintain higher lows, it opens the door for a potential continuation toward the next key targets:
$65.70: 61.8% retracement
$66.60: 78.6% retracement
$69.10–$71.38: Daily and Monthly breakdown levels (major resistance cluster)
Trend Phase Alignment and Probabilities
The monthly trend remains short.
The weekly and daily trends are now aligned long.
This divergence of trend direction between higher and lower timeframes suggests the market is in a corrective expansion phase rather than a full trend reversal. Expansion phases offer excellent short- to medium-term opportunities but can turn volatile without warning.
If price breaks below the weekly pivot zone (~$60.77), the bullish scenario is invalidated and a retest of the lower monthly channel could follow.
Conclusion
Oil is in a complex technical state:
Monthly: bearish channel intact
Weekly: bullish bounce from double Fibonacci confluence
Daily: breakout active but within a noisy correction zone
Until the higher timeframe trend breaks, the current move should be treated as a countertrend rally. Still, as long as the weekly pivot zone holds, bulls are in control on the lower timeframes, aiming for the $69–$71 resistance zone next.