


📉 BITCOIN // the short scenario
How the weekly would confirm that start of a deeper correction

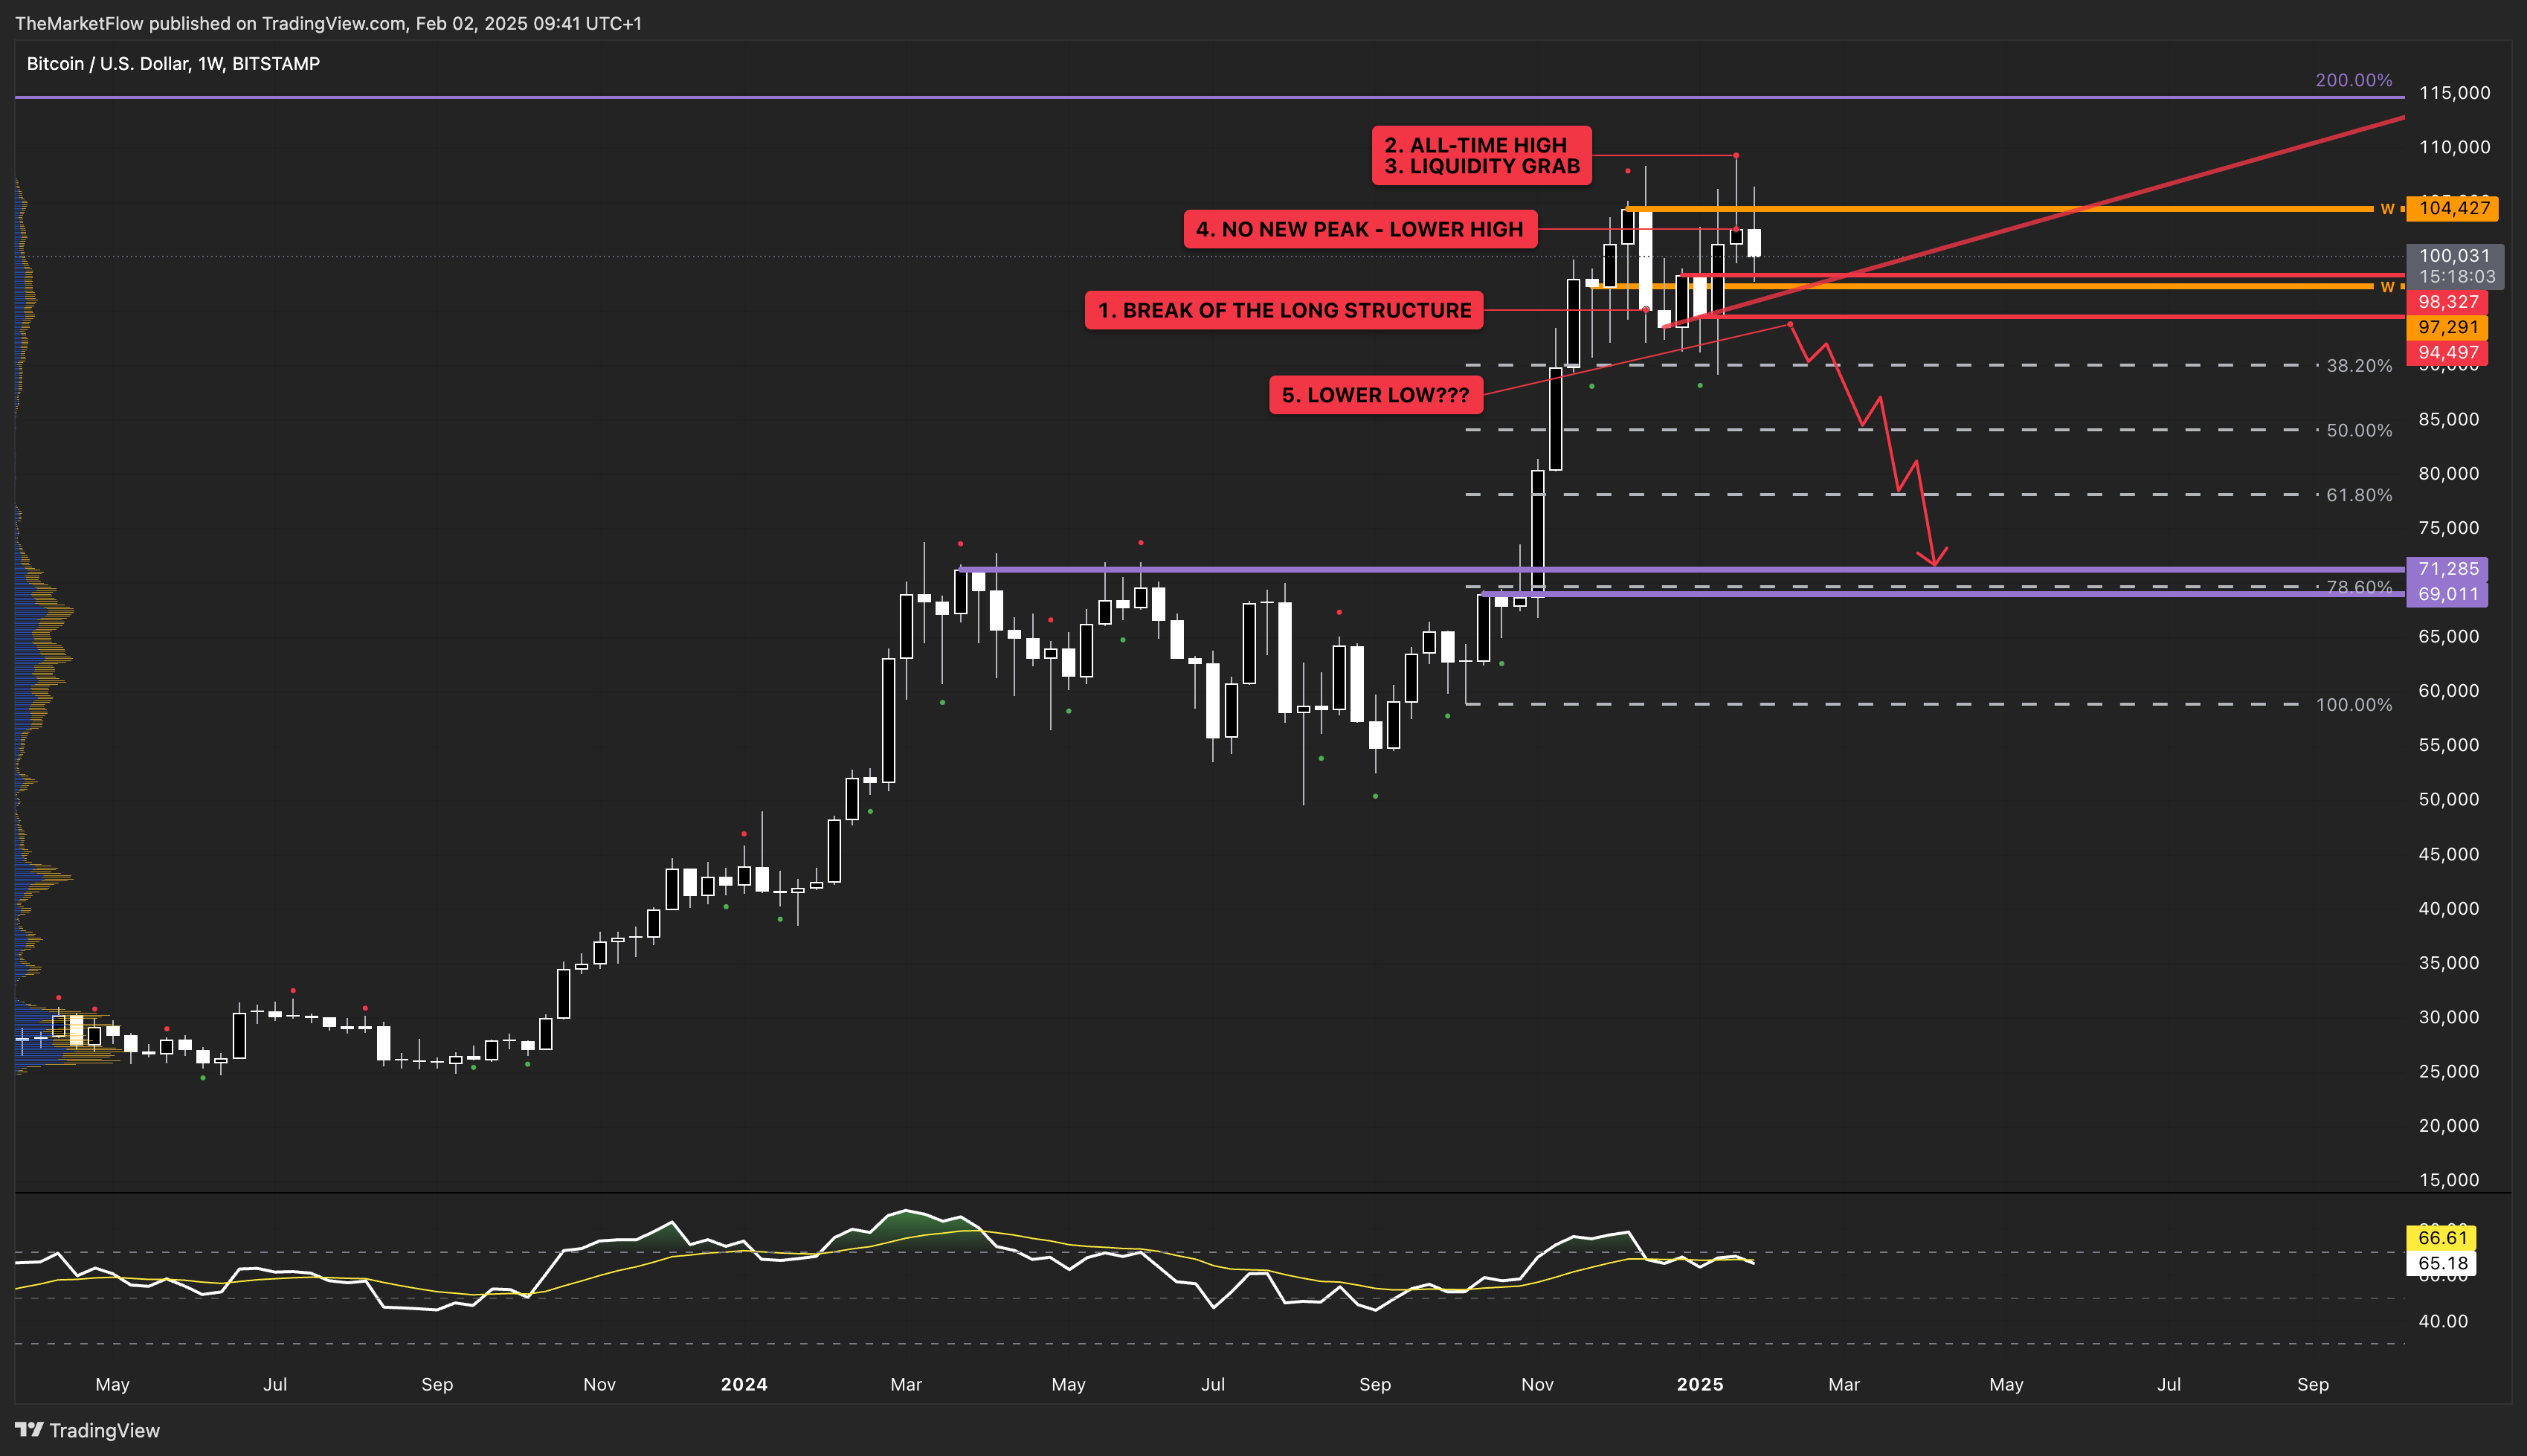
Key Chart (Weekly)
I’ve posted a letter yesterday about the market that was still in a long trend on the daily.

It became invalid very soon, and as the weekly chart points out, it was not an accident.
The clues the weekly chart gives us are the following:
The market closed below the last weekly impulse base. This created a new impulse base at the top (as of closing prices).
The market went to an all-time high…
…but couldn’t close there. There was a liquidity grab.
Then it closed below the new impulse base, making the short impulse still valid, creating a lower high (as of the close).
If there will be a new low (I always take the closing prices), the short weekly countertrend becomes valid, making the market more likely to go into a deeper correction.
The targets of this move are marked by the Fibonacci correction space (38.2-61.8) and the weekly breakout zone.
How long does it take for the market to go there?
Nobody knows.
But as long as this weekly short countertrend is valid (no break of the last impulse base with waves, and no break of the countertrend line drawn on the closes), the market has a chance to go there.
Key Fundamentals
I wrote some points in the article above, and the developments on the tariff war may have significant impacts on the Crypto universe as well, in my opinion, because it may raise inflation, strengthen the USD and make the FED more hawkish.
The only way to get it the other way round, is if the Bitcoin serves as a safe-haven.
But do you think it’s possible…?
