
WTI Crude Oil: Bullish Expansion Phase Eyes H1 Fibonacci Targets
Multi-timeframe alignment supports continuation; H1 diamond signals local hesitation, but higher targets remain in focus if breakout holds.

Market Overview
Crude oil (WTI) continues to present a structurally aligned bullish setup across all active timeframes. Price has completed a daily target move while lower timeframes consolidate near breakout zones. A sustained push higher could validate the next leg toward higher timeframe Fibonacci targets.
Monthly Trend
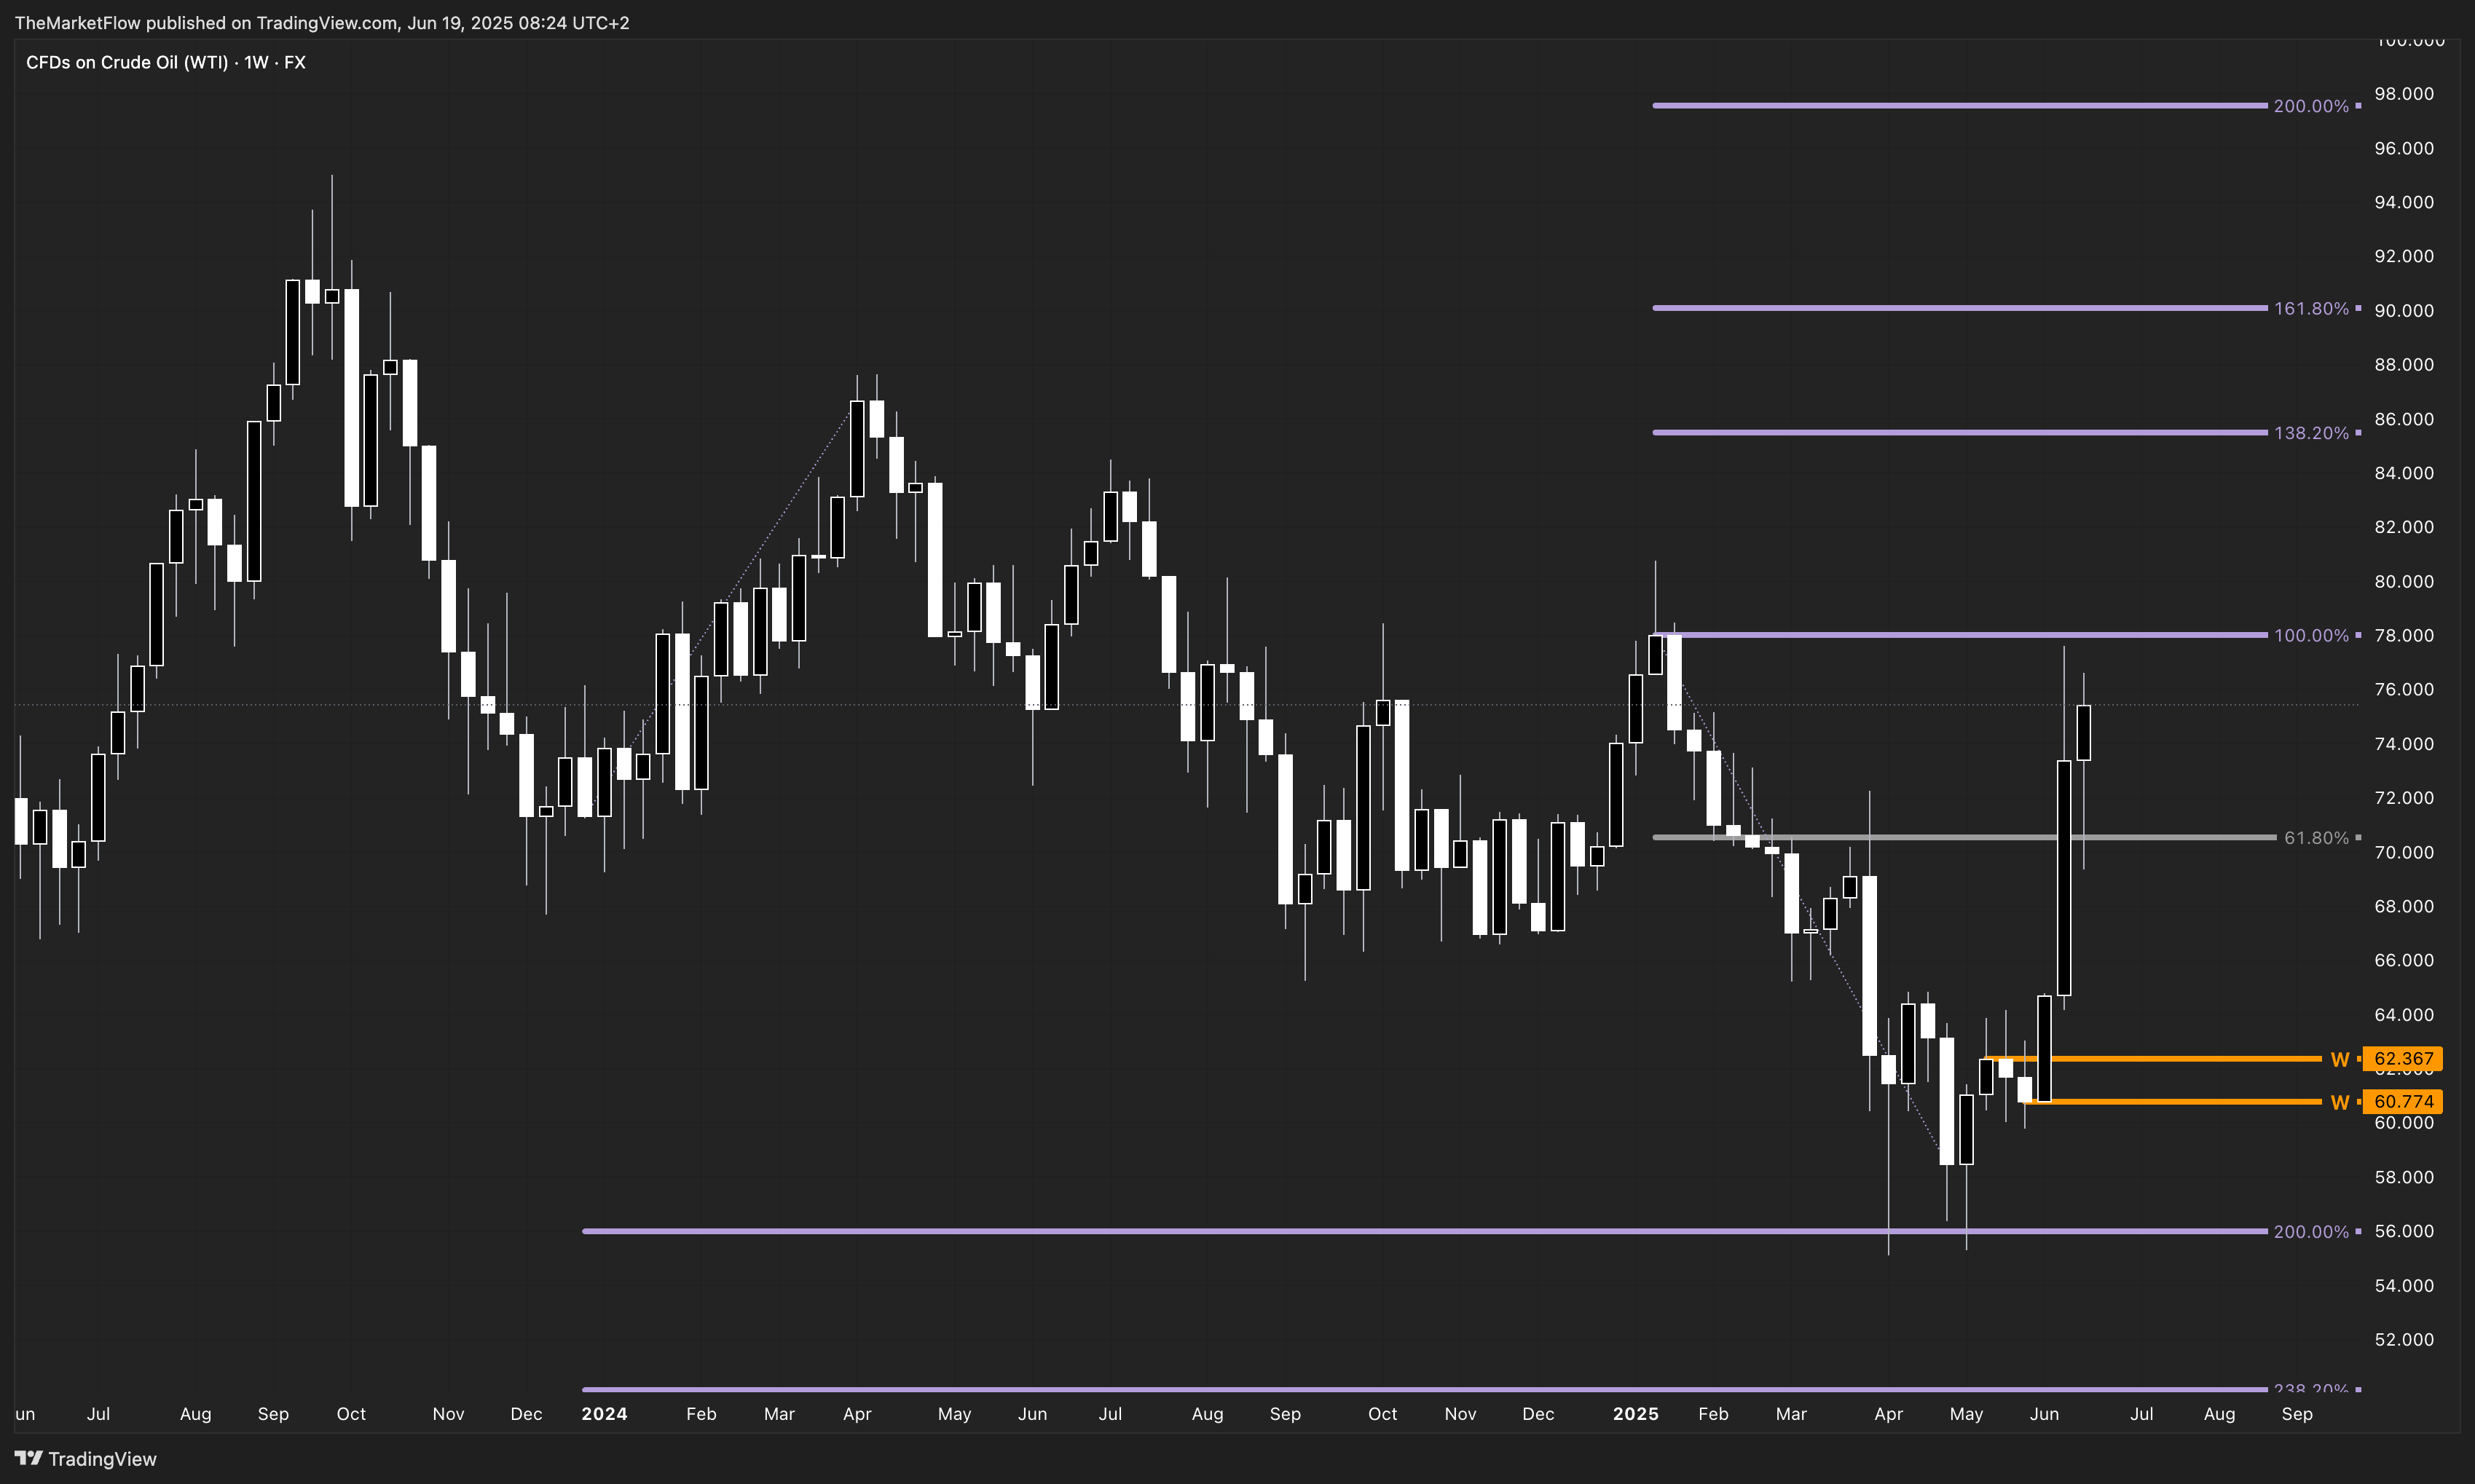
The monthly chart is attempting a breakout from a long-standing descending channel. Price has decisively reclaimed the $71.38–69.94 monthly pivot zone, establishing the first real challenge to the macro bearish structure in over a year. A continuation above $76.62 would validate the shift into a potential new expansion phase.

Weekly Structure
The weekly chart confirms a sequence of higher highs and higher lows. Price is advancing in a clear impulsive wave targeting the early 2025 high at $78.07—also the 100% weekly target Fibonacci level. This aligns with broader bullish momentum and supports a continuation toward the 138.2% and 161.8% extensions.
Daily Chart
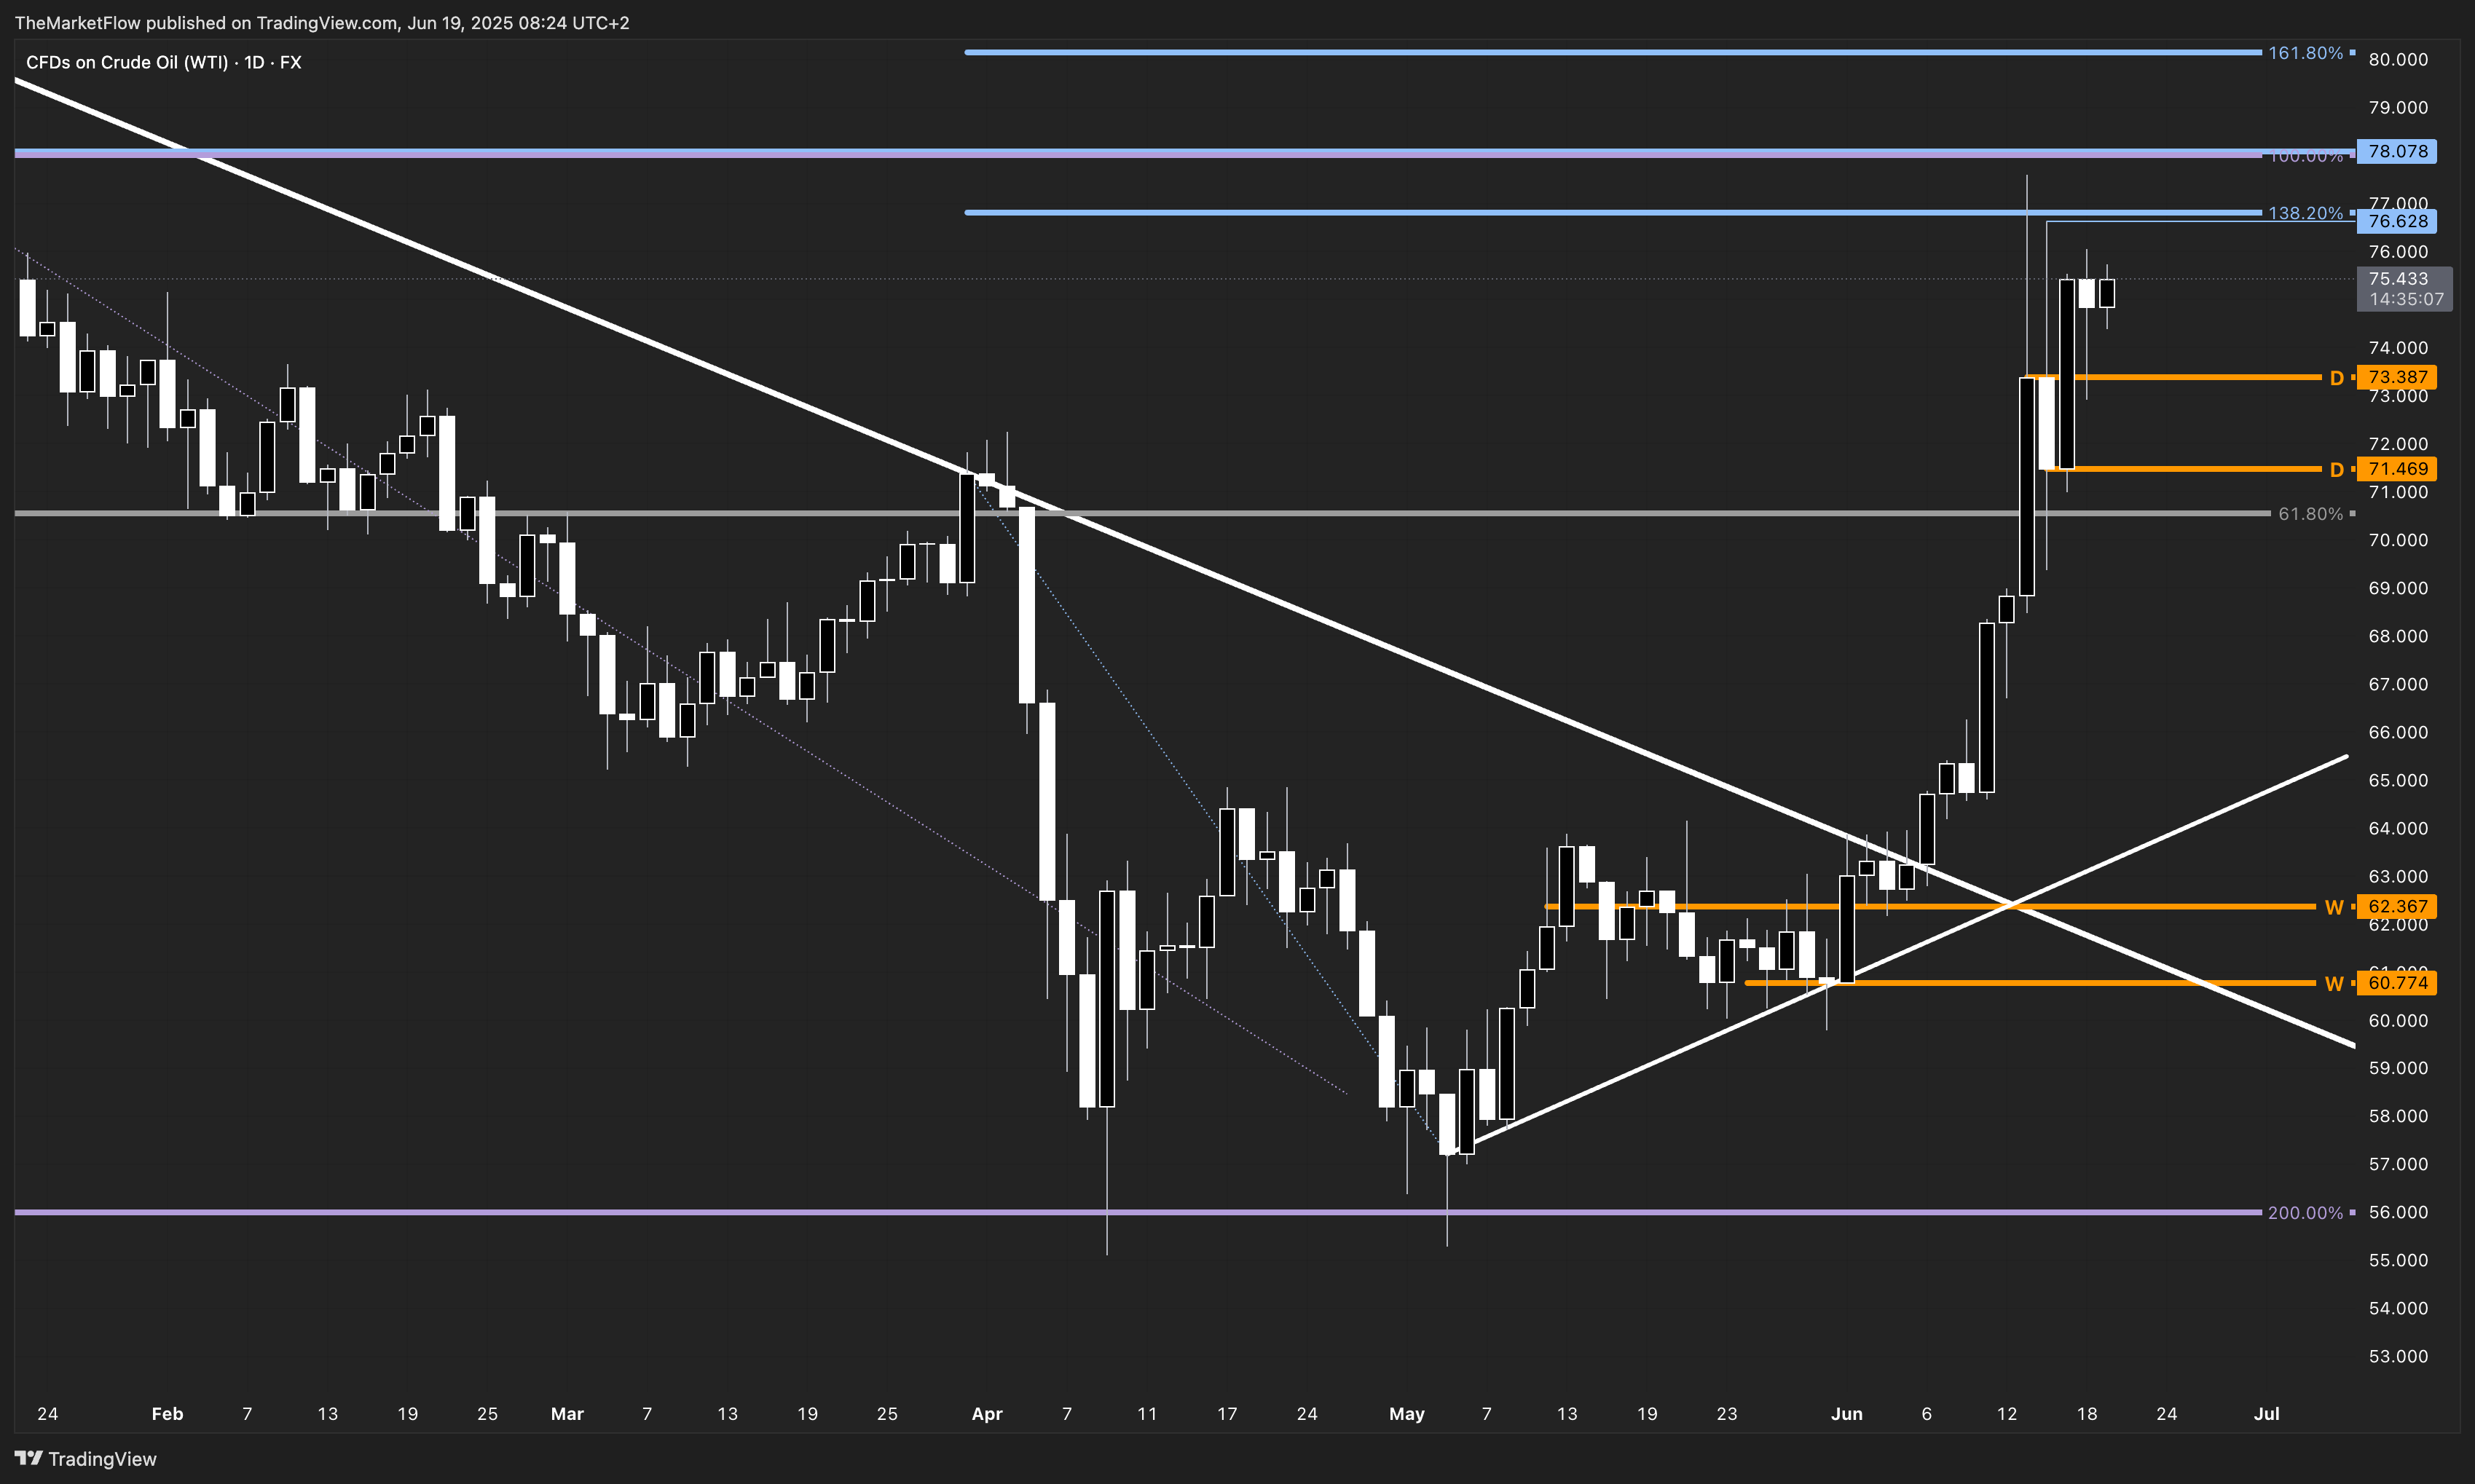
The daily structure remains long. Price recently hit the target Fibonacci 138.2% at $76.62, completing the current wave’s objective. Despite this, the daily structure remains intact with no signs of exhaustion yet. The path remains open toward the next resistance at $77.00 and $78.07 if momentum sustains.
H4 Timeframe
The H4 chart confirms bullish continuation, with price consolidating just below $76.05—mapped as a key 100% extension level. The consolidation appears healthy and maintains structure above the $74.23 pivot (H4 orange level). A clean breakout above $76.05 could initiate the next impulsive wave.

H1 Timeframe
A diamond formation has formed on the H1 chart, signaling market indecision. However, if the market breaks above the M15 breakdown area at $75.60, it could trigger a move toward the H1 target Fibonacci 161.8% near $77.00. This zone aligns with both the daily ATR projection and the weekly extension setup.

M15 Timeframe
M15 shows a series of tests near intraday highs. A potential breakout above the highest M15 breakdown at $75.60 would mark the confirmation of local accumulation and enable participation targeting higher timeframe resistance zones.

Key Trigger Levels
Bullish Trigger: Break above $75.60 (M15 breakdown reclaim)
Secondary Trigger: Clean close above $76.05 (H4 100% Fibonacci)
Target Zones
Daily Target Fibonacci: $76.81 (already tested)
Next Target (H1/Daily): $77.00–$77.30 (H1 161.8% + Daily ATR)
Weekly Fibonacci Target: $78.07 (100%)
Validity
The structure remains valid as long as price holds above the daily pivot zone at $71.47–$73.38.
Conclusion
WTI is in a structurally aligned bullish sequence from monthly to M15. The breakout attempt is underway, but momentum confirmation above $75.60 is critical. If achieved, the next leg targets $77.00 and above—aligned with H1 and weekly target Fibonacci zones.
Actionable Insight
Watch the $75.60–76.05 cluster closely. A breakout above this range could unlock rapid upside toward $77.00+. Until then, consolidation remains tactical. Invalidation sits below $73.38.
How are you interpreting this diamond structure on H1? Could it act as a launchpad or signal pause? Share your view in the comments—let’s compare frameworks.
Follow for more structured analysis across commodities—let’s build a conversation around precision trading.