

Weekly Timeframe – Target Reached with Impulse
On the weekly chart, the market broke through the previously valid weekly countertrend line with a strong impulse and reached the 123.6 Fibonacci extension level with momentum. The move displayed a clear structural character: it was a fast, decisive move that confirmed earlier trend continuation expectations.
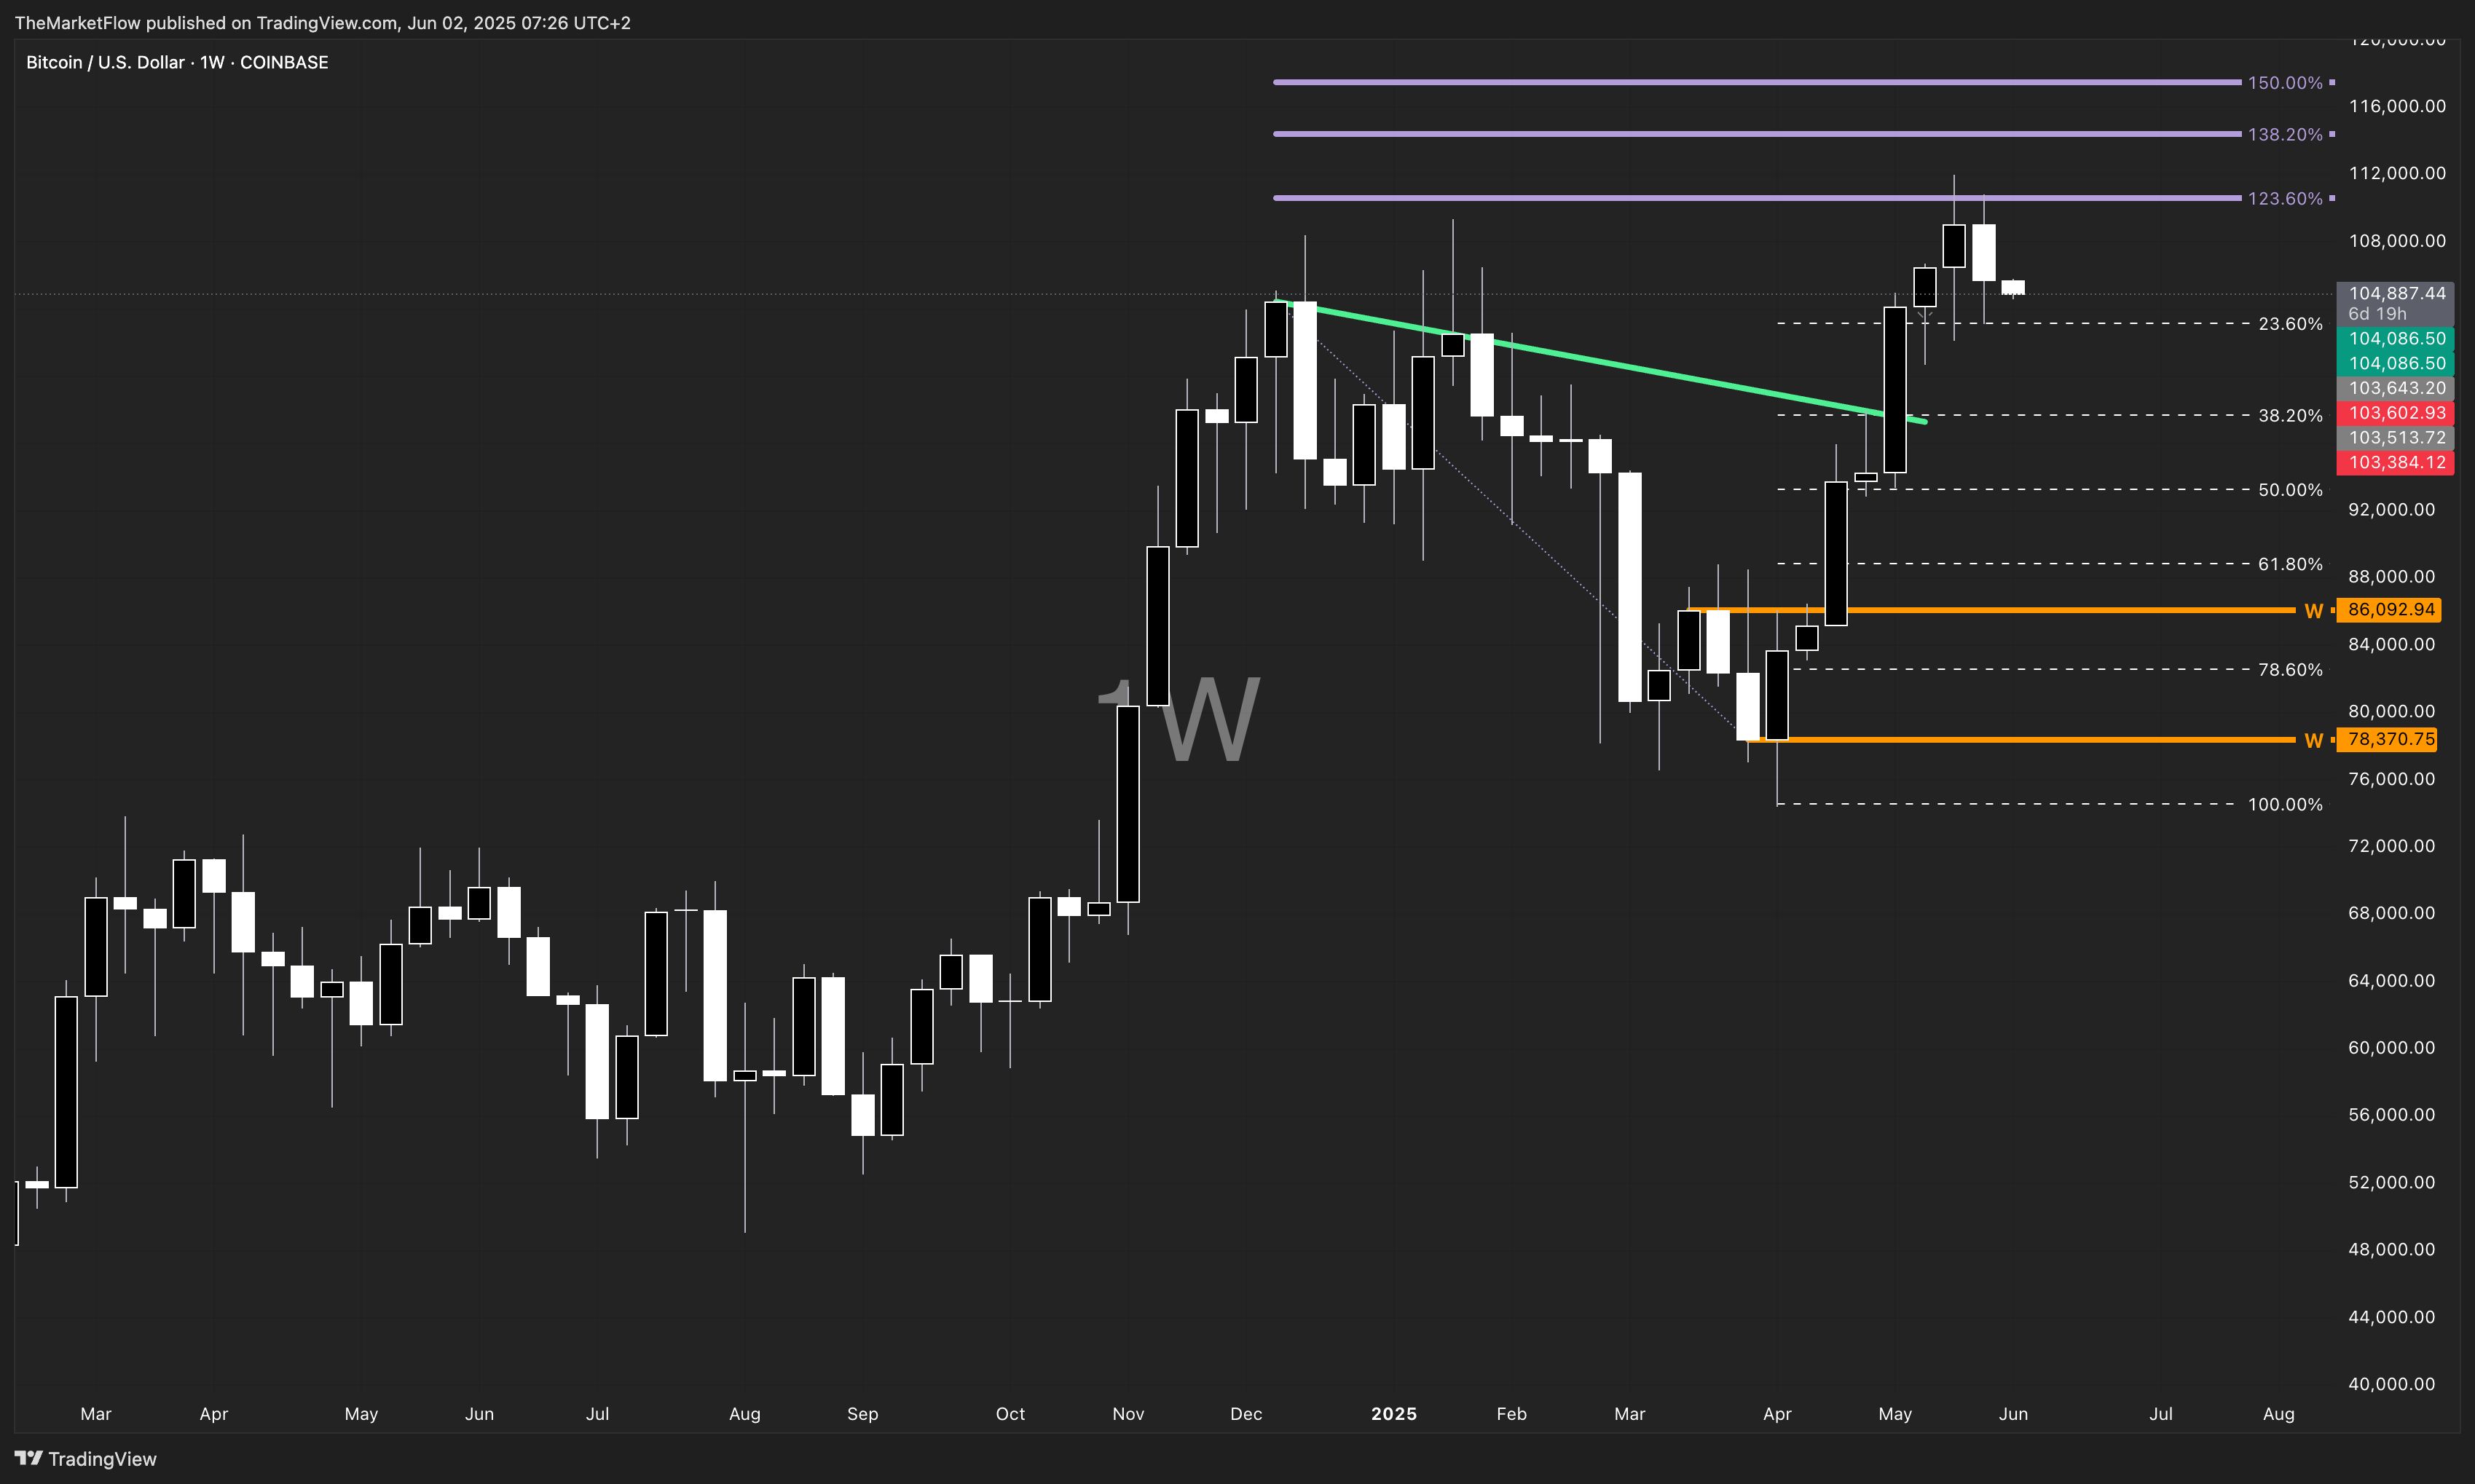
At the same time, this level also acted as a natural resistance – from here, technically-based profit-taking could have started, building a new countertrend structure, which smaller timeframes reveal in more detail.
Daily Timeframe – Corrective Structure and Entry Opportunities
On the daily timeframe, the correction has already begun. The current structure is forming a valid countertrend, which means that the current pullback is technically grounded and interpretable.
The daily pivot zone marked in orange acts as a key resistance area.
As long as the price stays below this level, the primary focus remains on short opportunities.

The second downward counter-impulse has already reached the 23.6 Fibonacci retracement level. This is the first “mandatory minimum” in a corrective structure. From here, two potential technical scenarios may unfold:
Counter-counter scenario: after another pullback, the next target could be the 38.2 Fibonacci level – typically the upper part of the corrective zone, from where selling pressure may resume.
Immediate continuation: if sellers maintain control, a direct breakdown from the 23.6 level is also a possible scenario.
It’s particularly worth watching for a reversal structure on the H4 timeframe after a daily breakdown – this could offer an excellent technical short entry.
Long Scenario – What’s Needed for Continuation?
The widely anticipated bullish scenario could activate if the market breaks through the daily pivot zone and the countertrend marked in white. In this case, we would be talking about the breakdown of the daily countertrend, which could open the way for new long impulses. Technically, such a breakout would project the continuation of the long trend visible on the weekly timeframe.
Such a wave movement would reactivate the Fibonacci target zones defined on the weekly chart, which already point to historical highs.
Summary
Technically, the daily countertrend is valid, marking the end of the weekly long impulse. There is room for short movement, but the market will become more interesting around the daily breakdown level, where good risk/reward opportunities may arise in both directions.
H4 has already turned and broke the long countertrend of the short countertrend.
The short scenario is likely to unfold.