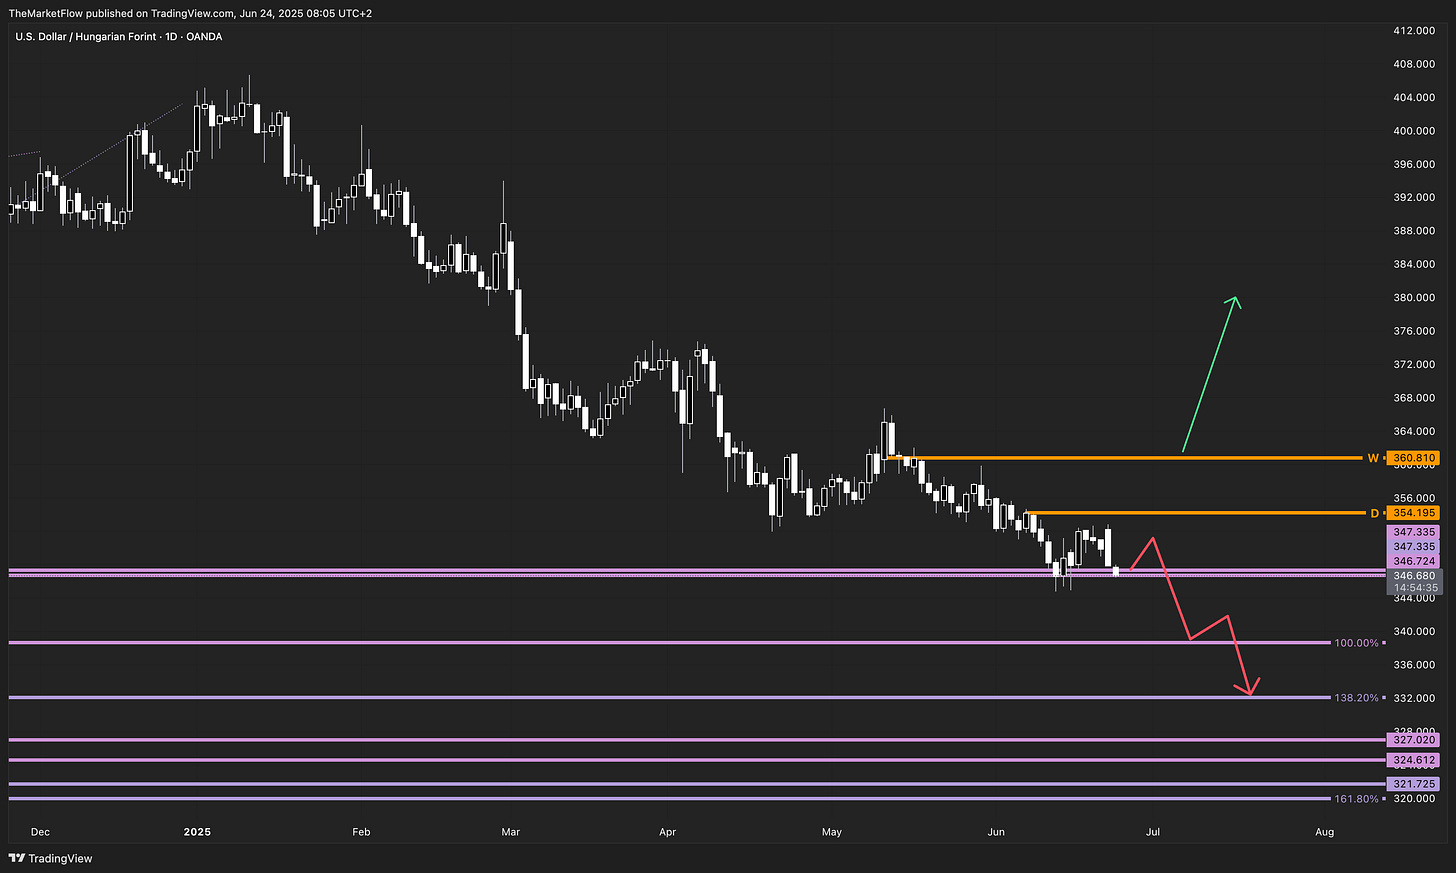
USD/HUF – Testing the Bottom of the Monthly Megatrend
Key Decision Point Near 347.335–346.724 with Clean Breakdown Risk Toward 324.612
Market Overview
USD/HUF is at a pivotal multi-timeframe structure zone. The pair is reacting to a cluster of long-term levels, testing the base of the monthly megatrend structure after an extended bearish leg. While the short trend is intact on lower timeframes, higher timeframe support has not yet cleanly broken—creating a technically significant inflection point.
Monthly Trend
The pair has broken below the prior monthly pivot at 355.580, but the current candle has not yet closed below it. Price has reacted to the monthly technical zone at 347.335–346.724, halting the decline—for now. A close below this zone would validate the next leg toward the monthly breakout zone at 327.020–324.612, with a deeper technical target near 321.725, aligning with the 161.8% monthly target Fibonacci.
Weekly Structure
The weekly chart confirms a short trend continuation phase. Price is descending cleanly and heading toward the daily 138.2% target Fibonacci at approximately 332.000, just above a prior weekly low. The structure suggests no interruption to this bearish flow unless the weekly pivot at 360.810 is reclaimed.
Daily Chart
The short trend remains intact on the daily, with price respecting the lower highs and clean breakdowns. The market is compressing just above the monthly support zone, hinting at either:
A short-term bounce to retest the daily pivot at 354.195, or
A continuation through the current support zone toward the 100% monthly Fibonacci target and the weekly 138.2% extension.
No reversal signs are visible unless a daily close reclaims higher pivot territory.
Key Trigger Levels
Long Trigger (Long Reversal Validity): Weekly pivot at 360.810
Short Trigger (Short Continuation Validity): Clean break and close below 346.724
Target Zones
Monthly Target Fibonacci (100%): 338.500
Monthly Breakout Zone: 327.020–324.612
Extended Monthly Target (138.2%): 316.000
Validity
The structure remains valid below the daily pivot at 354.195. Any move above the weekly pivot (360.810) would shift the short thesis toward a possible macro correction or reversal phase.
Conclusion
USD/HUF is sitting at the edge of a significant monthly support. The short trend is clean across timeframes, but price is confronting a historical support zone. A clean breakdown opens room toward 330.000 and below, while a move above 360.810 invalidates the short setup and opens long continuation potential.
Actionable Insight
Watch for a clean daily close below 346.724 for continuation. If bulls reclaim 360.810, shift focus toward long setups aligned with the higher timeframe pivot recovery.
How are you interpreting this monthly zone compression? Share your view in the comments—let’s compare frameworks.


