
US10Y – Multi-Timeframe Breakout Towards Expansion
Trend alignment signals continuation, with a clear short-term reaction zone and mid-term target in sight

Market: US 10-Year Treasury Yield
Timeframes: Weekly / Daily / H4
Status: Bullish trend resumption
Primary Target: 4.689% (Daily Target Fibonacci 138.2%)
⚠️ WARNING: US CPI data is coming today.
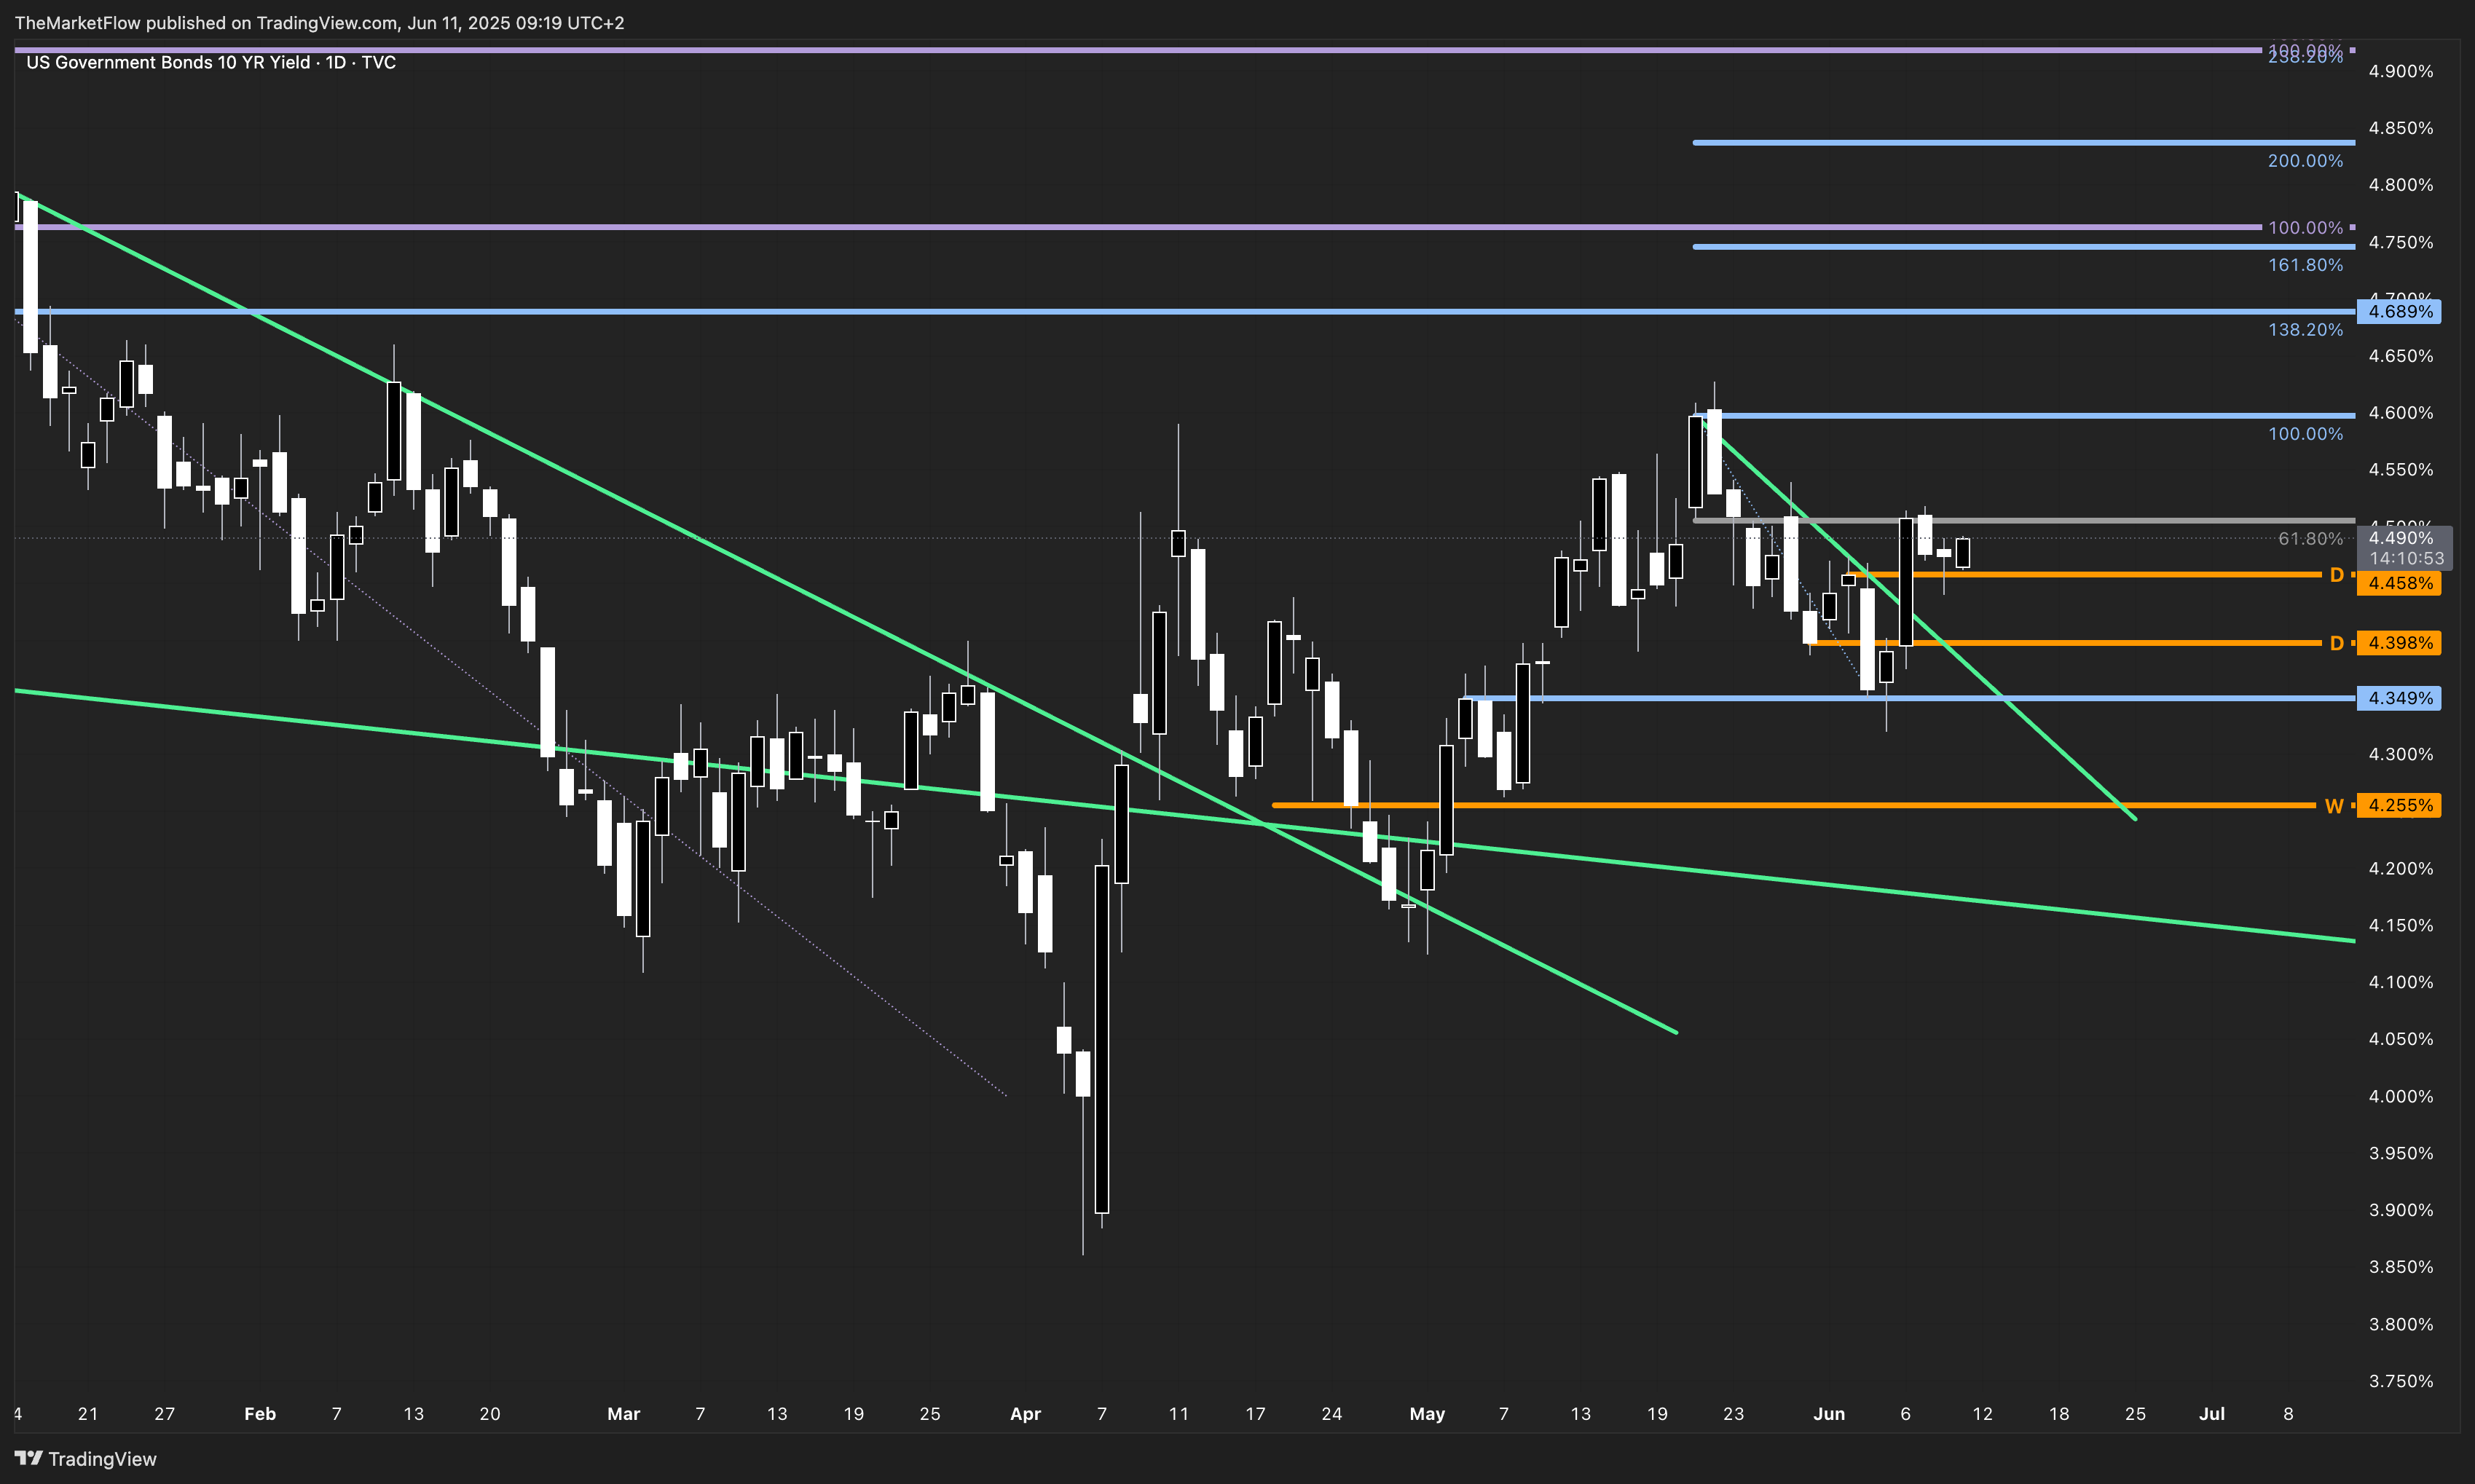
Weekly Overview – Long-Term Trend Intact
On the weekly timeframe, the market remains in a well-established long trend, characterized by a series of higher highs and higher lows. The structure is clean, and there are no signs of trend exhaustion. The market has not entered any long-term correction zone, and the bullish structure is technically valid and dominant.

This structural context sets the foundation for any lower timeframe analysis. As long as the weekly pivot (not violated) remains intact, the bias stays firmly long. The price action supports an ongoing expansion phase, especially given the confirmation now visible on the lower timeframes.
Daily Structure – Countertrend Broken, Target Active
The daily timeframe had been in a short countertrend, but this has now been cleanly invalidated by a strong bullish impulse. The move broke through the previous lower high with a decisive candle, closing above resistance and resuming alignment with the weekly trend.
The next logical target lies at the Daily Fibonacci 138.2 extension, located at 4.689%, which also corresponds with a clean historical breakdown zone on the daily chart.
This dual significance makes 4.689% a critical reaction zone—it is both a target and a structural test level.
As long as the market remains above the daily pivot zone, the bias remains bullish toward this target.
H4 Confirmation – Clean Breakout with Wave Structure
Zooming in on the H4 timeframe, we see a textbook confirmation of trend resumption:
The previous H4 short countertrend has been broken with a strong, well-defined bullish wave.
Importantly, this wave closed above the last southward impulse, which had been a clean breakdown level.
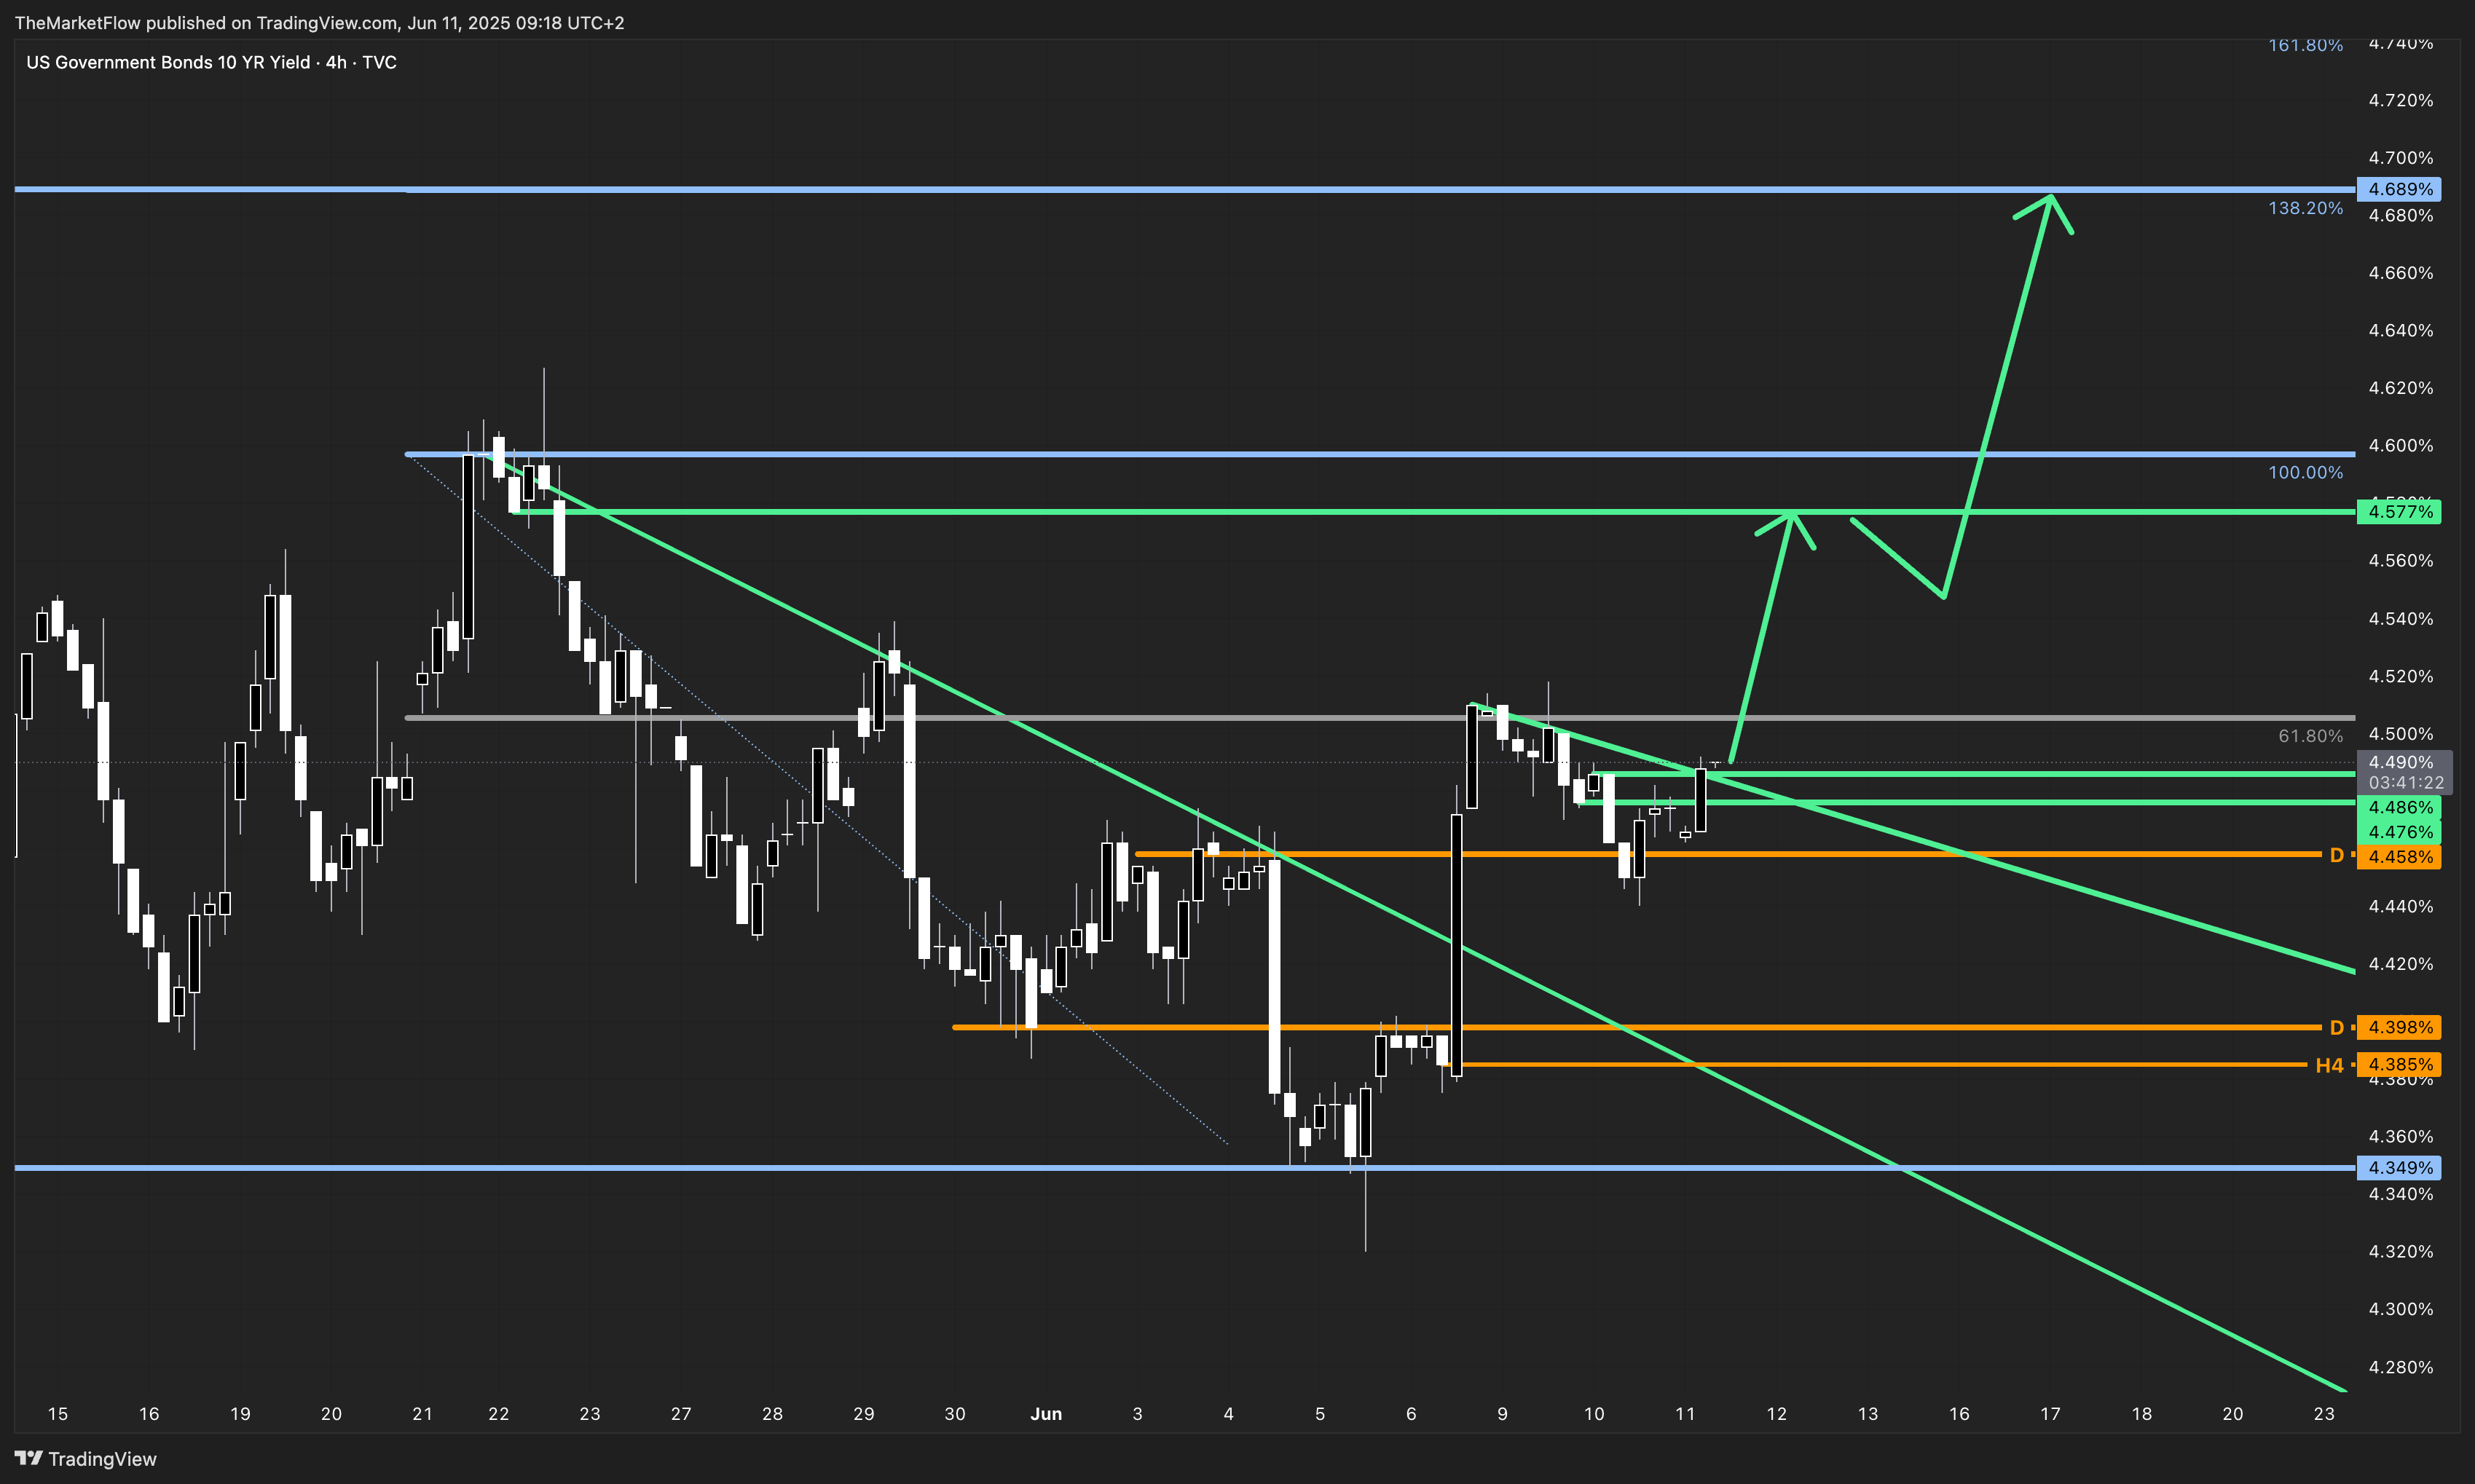
The highest clean H4 breakdown zone (at 4.577%) is now the first local target. This level acts as a short-term reaction zone, where bulls may take partial profits or reload positions.
If price consolidates above this H4 zone, it may act as a launchpad toward the higher timeframe target at 4.689%.
A rejection at this level may bring about a retest of the broken daily or H4 pivots, but would not invalidate the long bias unless those zones are broken.
Conclusion – Expansion in Progress
The US10Y is now in a multi-timeframe bullish alignment, with the weekly, daily, and H4 structures all pointing toward further upside. The path to 4.689% is structurally supported, with short-term reaction zones offering tactical entries for trend-followers.
As always, trend alignment does not equal certainty—but it creates an environment where expansion phases are more likely. Traders may consider long setups on valid pullbacks or breakout continuations, keeping an eye on price behavior around the H4 reaction zone and the daily target.
If you found this analysis helpful, consider leaving a like to support my work—it’s a small click that goes a long way. 🫶🏼
Have thoughts, questions, or want me to analyze a specific market? Just drop a comment below.