US 10-Year Yield: All Timeframes in Sync for a Bullish Expansion
Daily Trigger Candle Confirms Breakout – Bullish Momentum Builds Across the Curve
Monthly Trend – Expansion Confirmed Above Key Resistance
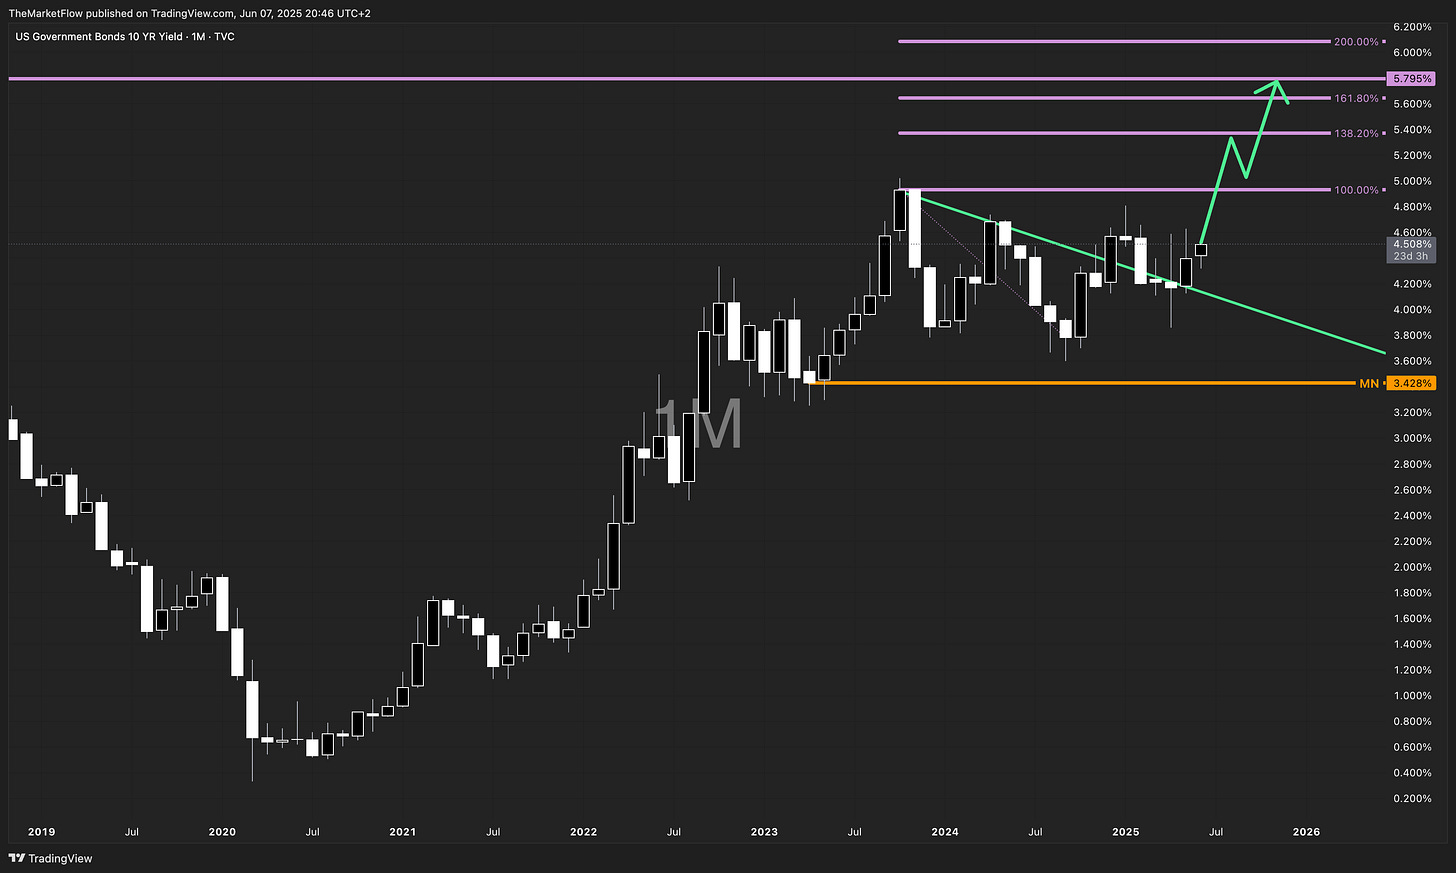
On the monthly chart, the long-term uptrend remains intact and dominant. The short countertrend line has been decisively broken, confirming the end of the consolidation phase and initiating a new expansion leg.
The market has reclaimed territory above previous resistance levels and now eyes the Fibonacci extension targets at 5.40%, 5.60%, and ultimately 5.79%, which mark the 138.2%, 161.8% extensions and a monthly breakdown respectively. The structure suggests increasing upward momentum, supported by the large bullish breakout candle on the daily that invalidates prior bearish pressure.
Weekly Trend – Structural Break and Expansion Phase
The weekly chart supports the bullish case with a confirmed breakout above the falling wedge structure. Price has now closed above key resistance levels and is sustaining above the prior breakdown zone.
This validates the expansion phase that was already forming on the monthly.
Weekly Fibonacci extension levels align with the monthly targets, with a clear path towards 5.40%–5.80%, unless invalidated by a breakdown below the 4.25% weekly pivot zone. The trendline break further adds to the technical confluence for higher yields ahead.
Daily Trend – Breakout Trigger Confirms Bullish Continuation
The daily chart reveals a fresh breakout above the short-term descending trendline, confirmed by a strong bullish trigger candle.
This move follows a successful defense of the key support levels at 4.34%, 4.39%, and 4.45%, forming a solid base for continuation.
The breakout has occurred just below the 61.8% retracement, and a daily close above 4.51% sets the stage for a run toward 4.69%, a clean daily breakdown, with further targets at 4.76% and 4.83% on the daily timeframe.
With all higher timeframes aligned and the trend structure clean, this sets up a textbook bullish expansion scenario.
Conclusion
All three major timeframes—monthly, weekly, and daily—are now aligned to the upside in a bullish expansion phase. The technical structure suggests the path of least resistance is higher, with breakout confirmations across all charts.
As long as the key pivot levels (especially 4.25% on the weekly and 4.39–4.45% on the daily) remain intact, this market has significant upside potential, with 5.40%–5.80% as long-term targets.
This setup represents a strong momentum continuation across timeframes—yield traders and macro participants should take note.
This analysis is not a forecast. It reflects the structure of the market and the zones where trend alignment across timeframes may trigger expansion phases.


