
DAX: Signs of Exhaustion at Long-Term Fibonacci Target
Weekly Impulse Reaches 138.2%, Lower Timeframes Show Structural Cracks Ahead of NFP

Weekly Context
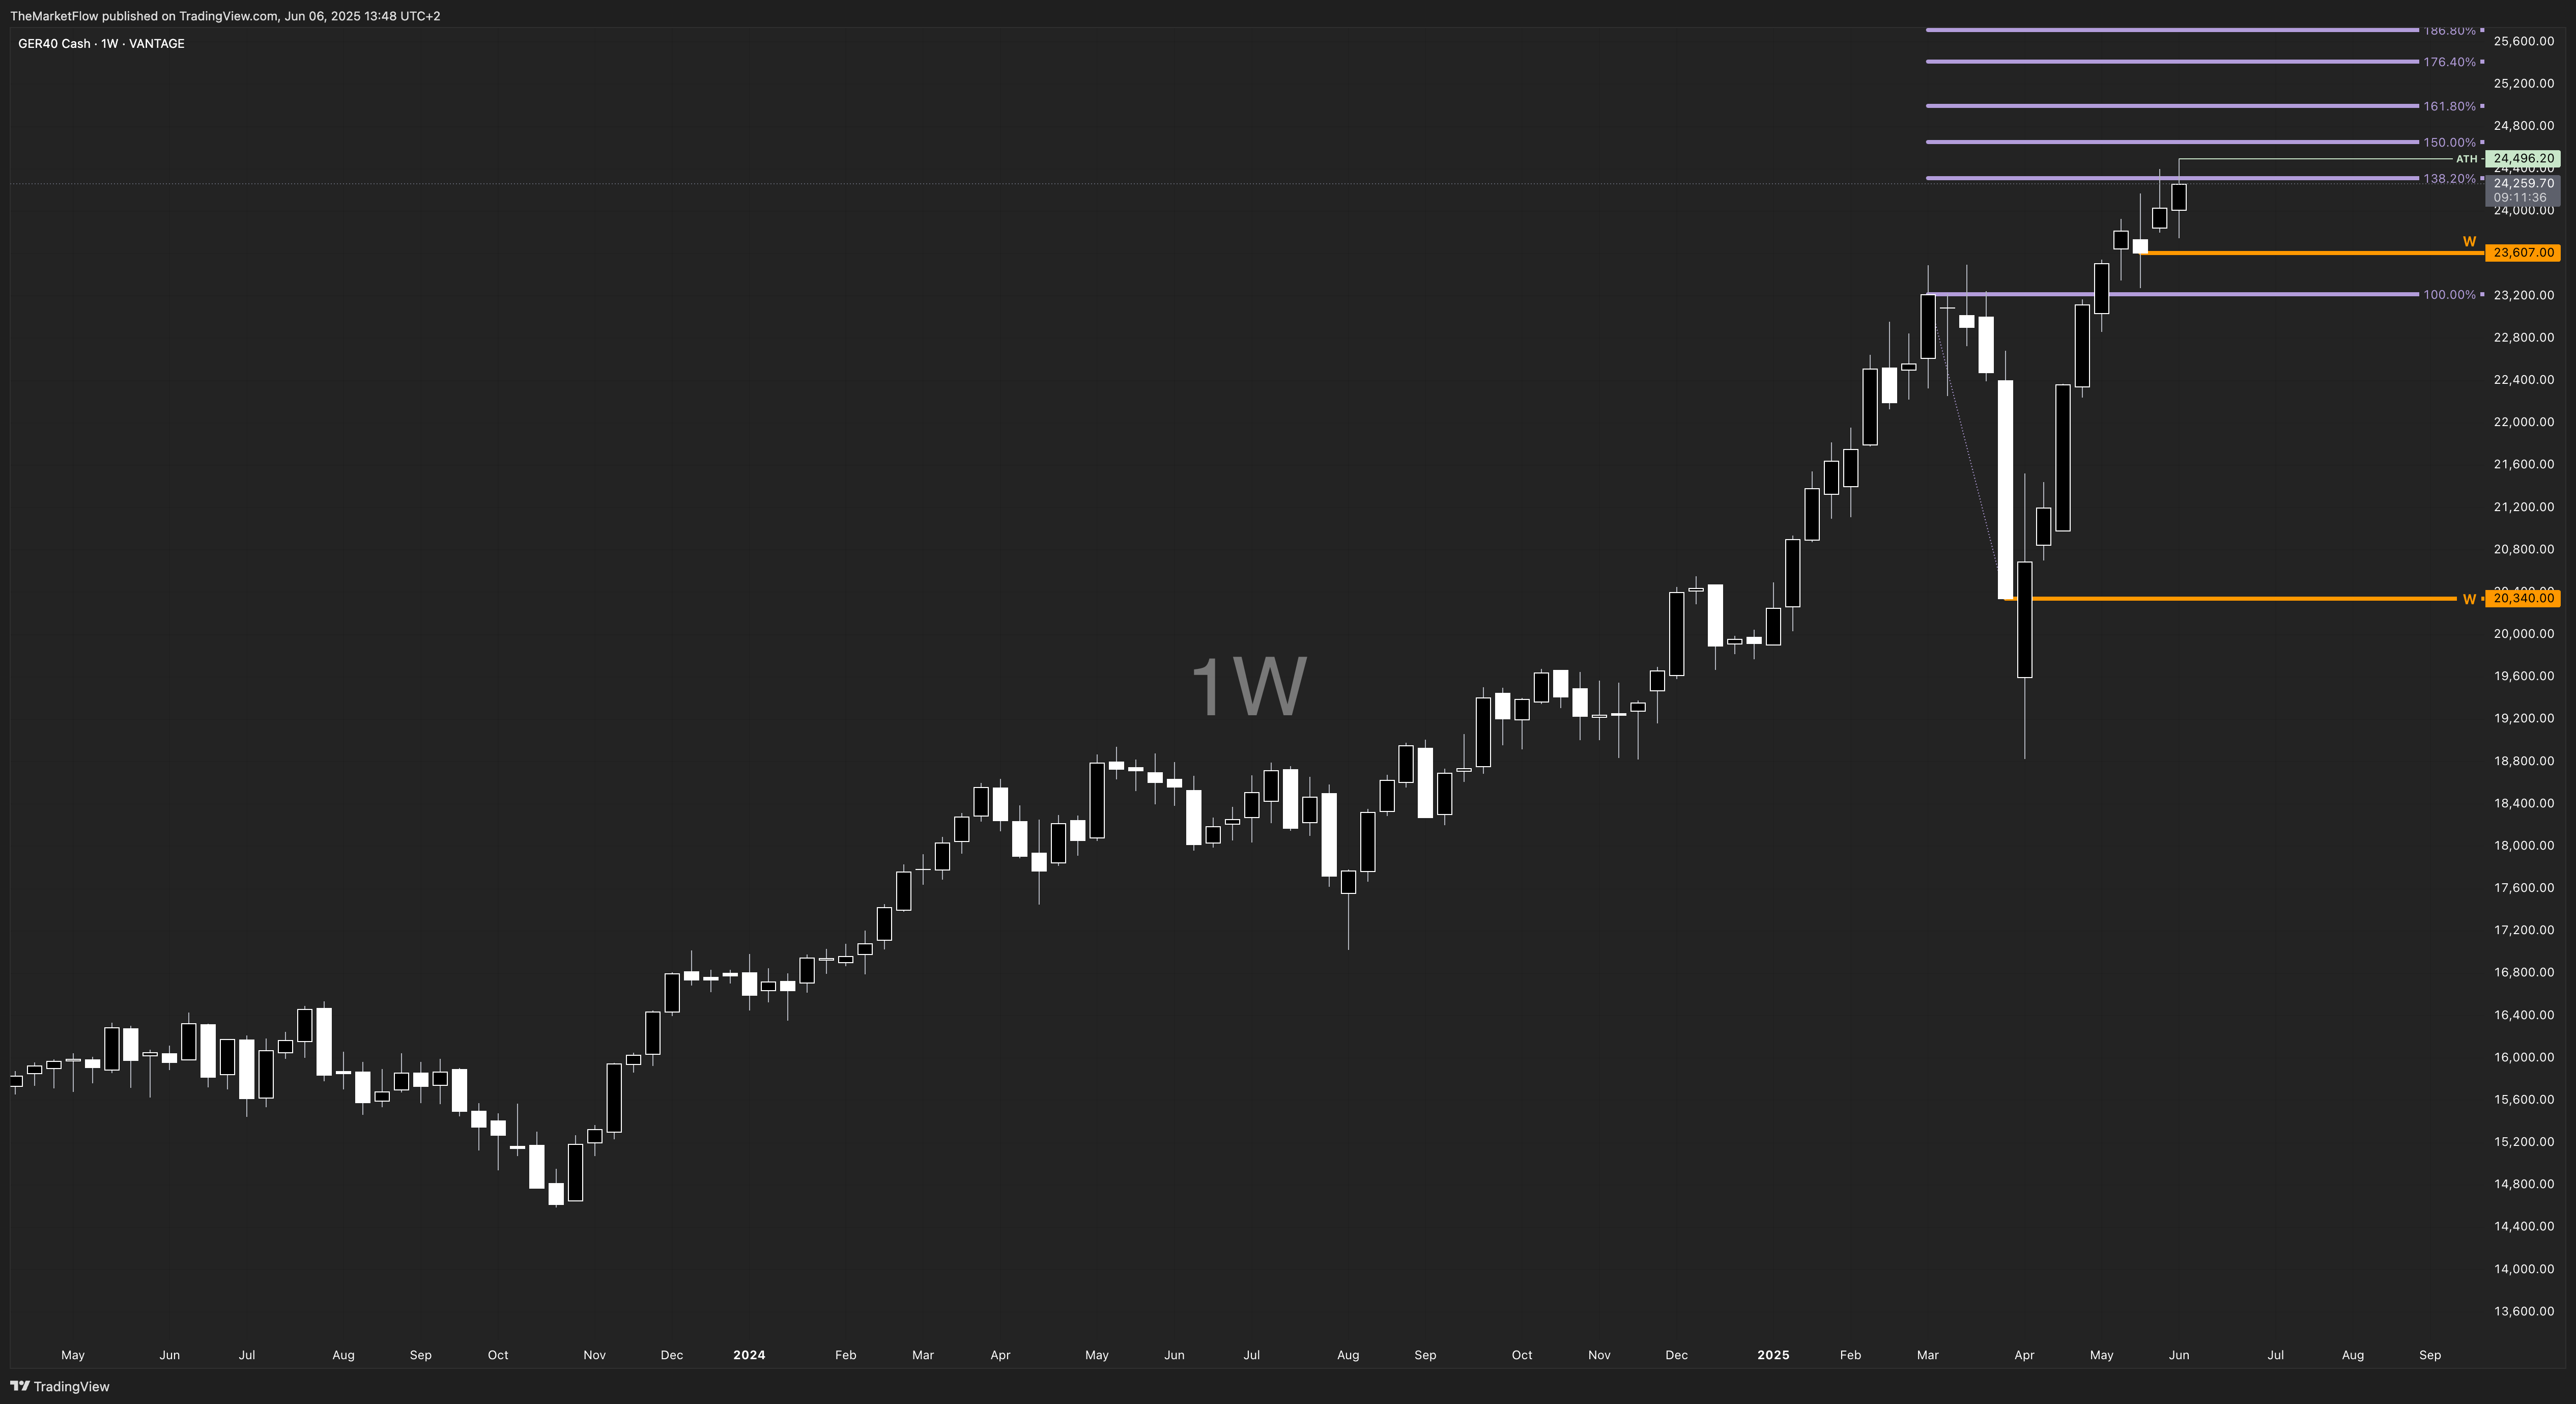
The long-term uptrend remains intact on the weekly chart, with the latest bullish impulse extending aggressively to the Fibonacci 138.2% target zone. This move marks a significant long-term objective being met. However, the market printed a shooting star candle at this level — a classical signal of potential exhaustion, especially when aligned with a meaningful Fibonacci target.
Daily Outlook

On the daily timeframe, the market stalled near the weekly 138.2% and has yet to break structurally to the downside, but momentum is clearly weakening. The shooting star, printed near the Fibonacci resistance, supports the case for a potential correction — even if only temporary. The trend remains long, but upside continuation would now require fresh momentum and a confirmed break above the previous high.
H4 Structure

The H4 chart confirms the first break of long structure, suggesting that the prior bullish leg may be losing control. That said, there is no clear 3-wave corrective structure yet, which means the break could still turn into a fake-out unless confirmed by a lower high and deeper retracement. The market currently hovers near the H4 structure break level and may retest this zone before showing its hand.
H1 Breakdown & Scenario Planning

On the 1H chart, the break of long structure is more pronounced, and the price is consolidating below a descending trendline. The lack of immediate follow-through after the structure break suggests indecision — likely due to the upcoming NFP release, which tends to suppress directional conviction. Two scenarios are in play:
Bullish Case: A clean break above the H1 descending trendline and 24,380 area could reopen the path toward the 138.2–161.8% Fib extensions, confirming trend continuation.
Bearish Case: A failure to reclaim the broken structure and a move below the 24,098 H1 low would trigger a deeper correction, possibly targeting previous demand zones or untested H4 supports.
Conclusion
While the broader trend is still bullish, the weekly target hit, shooting star candle, and break of structure on H4 and H1 suggest the uptrend is entering a vulnerable phase. With NFP data ahead, volatility is expected, and traders should stay nimble. The absence of a developed bearish wave structure leaves the situation technically undecided, but risk management should now prioritize downside protection for existing longs.
Key Levels to Watch
Upside continuation above: 24,380 → 24,430 → 24,560
Breakdown below: 24,098 → 23,960 → 23,680