
💰Reversal in Progress—or Just a Pause?
USD Index: A key weekly pivot and long-term Fibonacci targets hold the balance between bearish continuation and bullish resurgence.

Bullish Megatrend
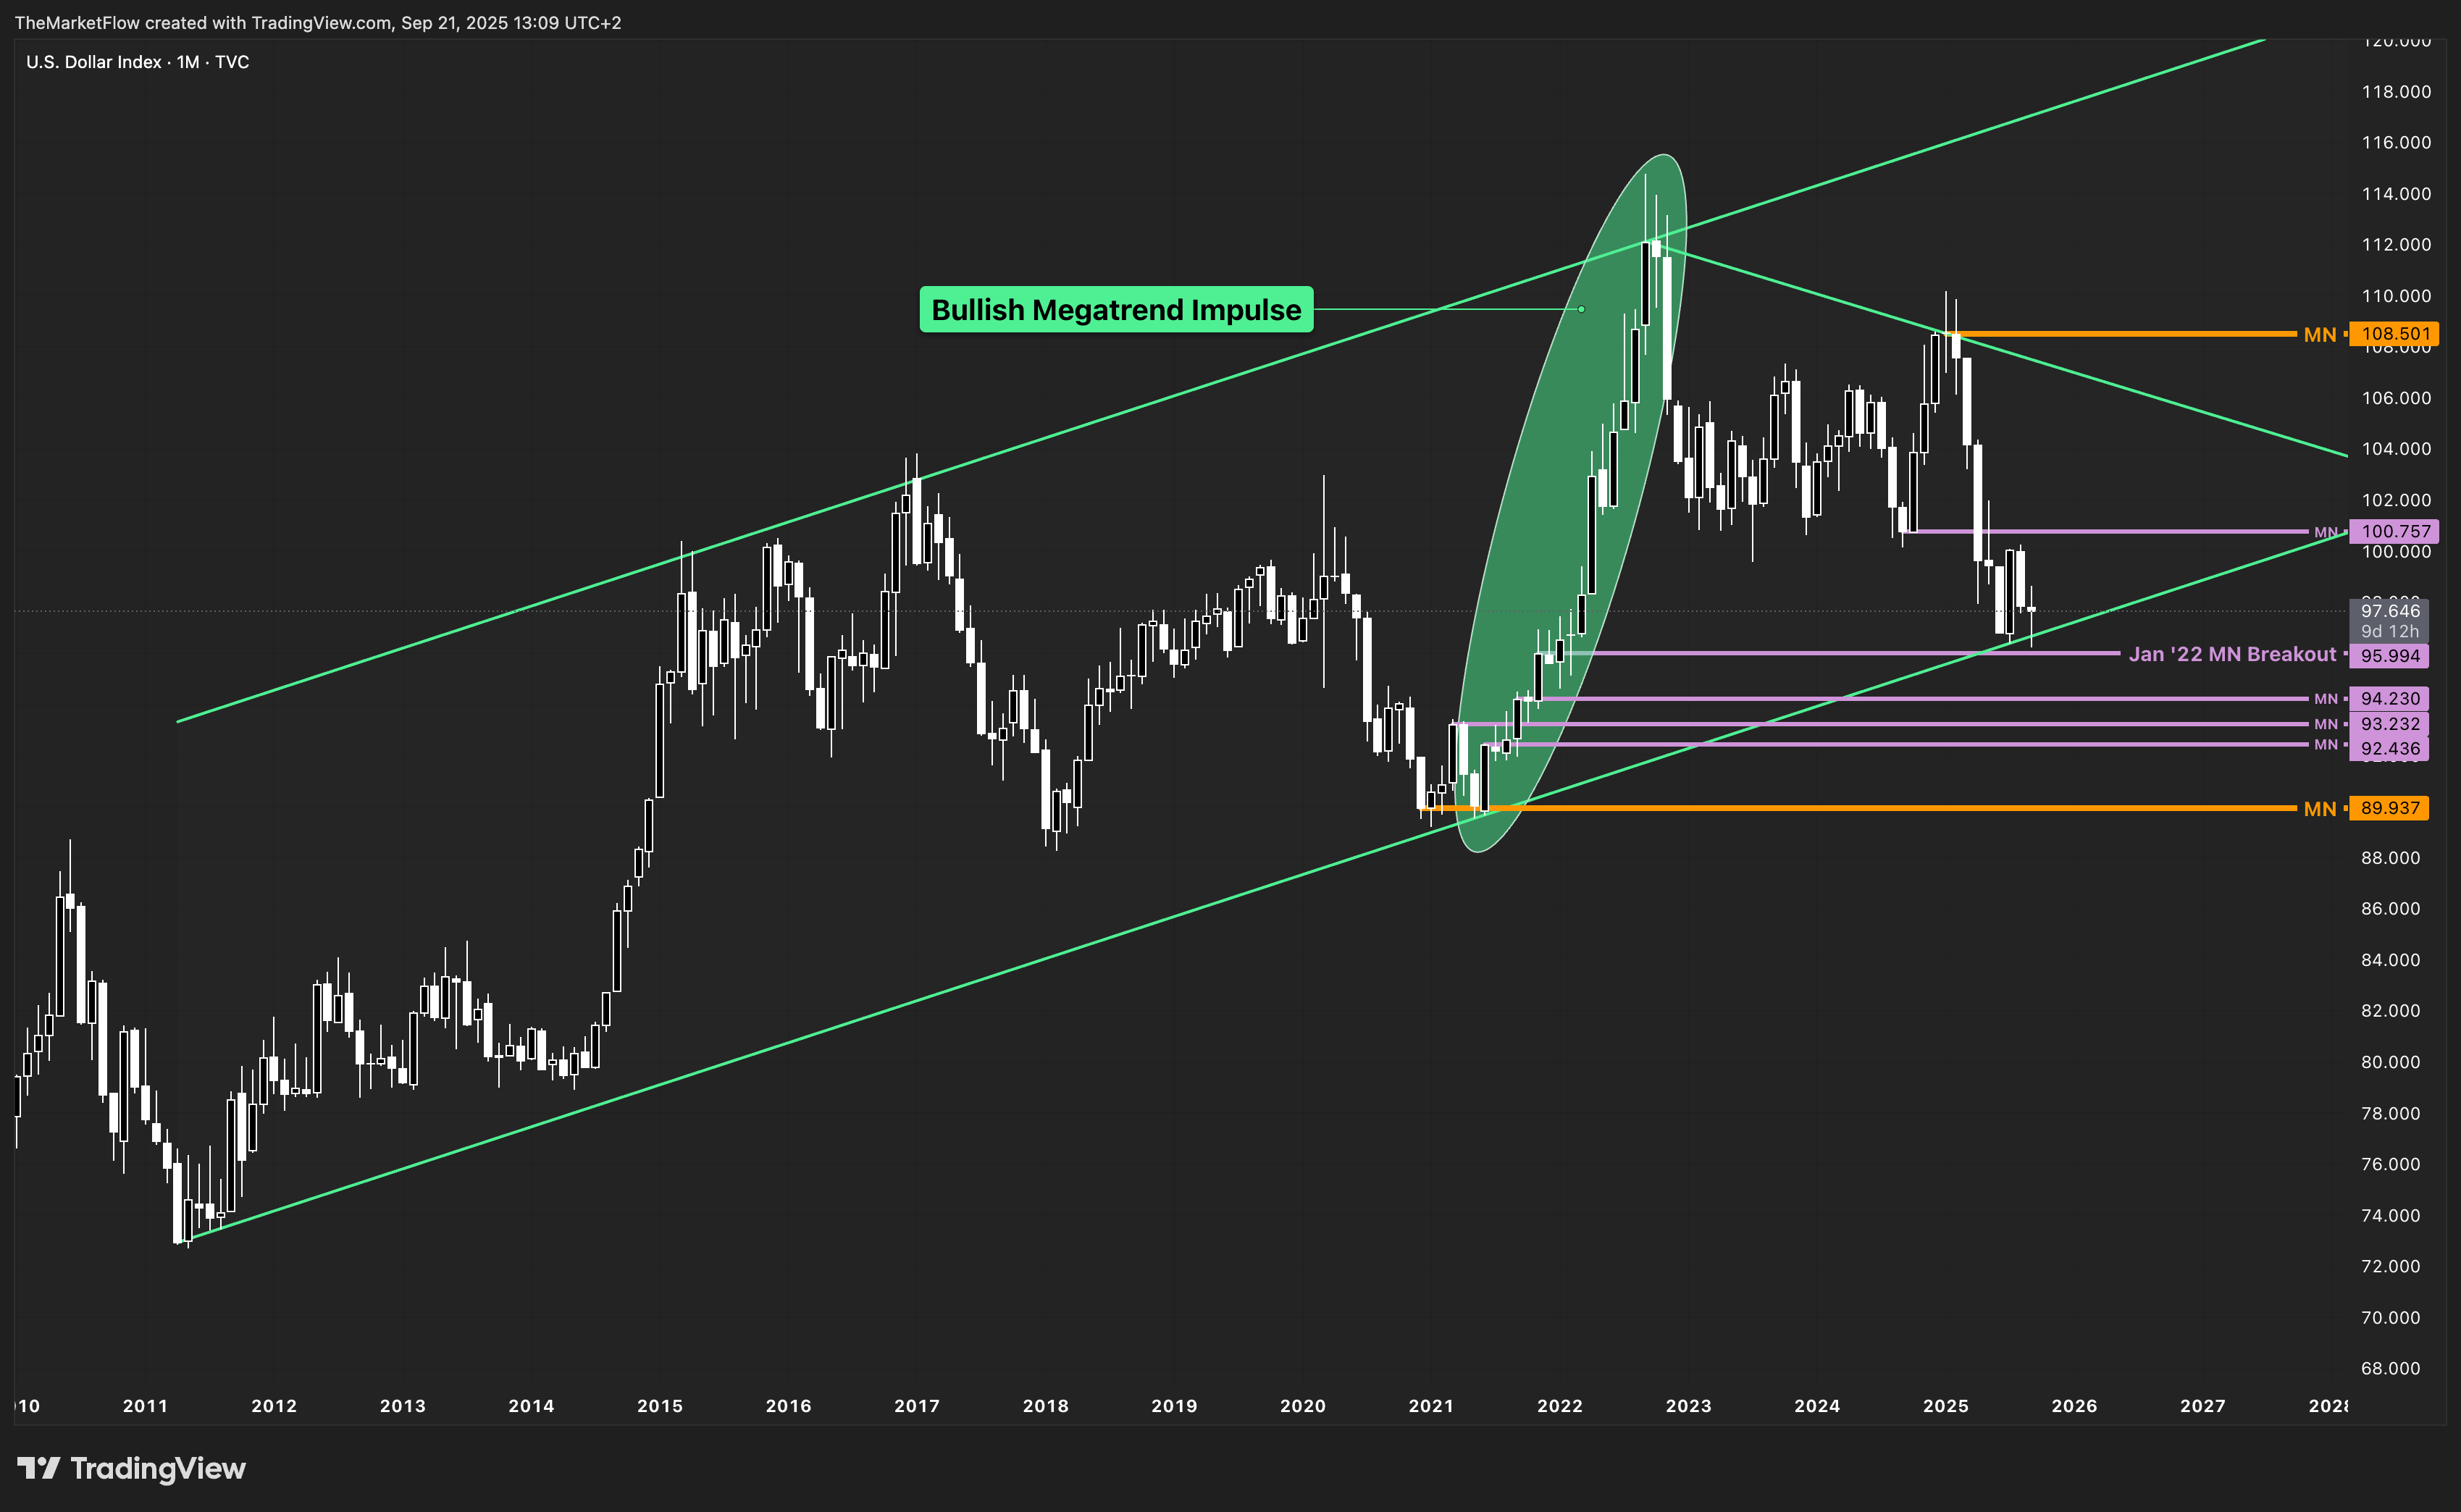
The bullish megatrend has been valid since 2008.
The monthly bearish countertrend is also valid, with the most recent bearish impulse starting in January 2025.
Key Chart | Weekly
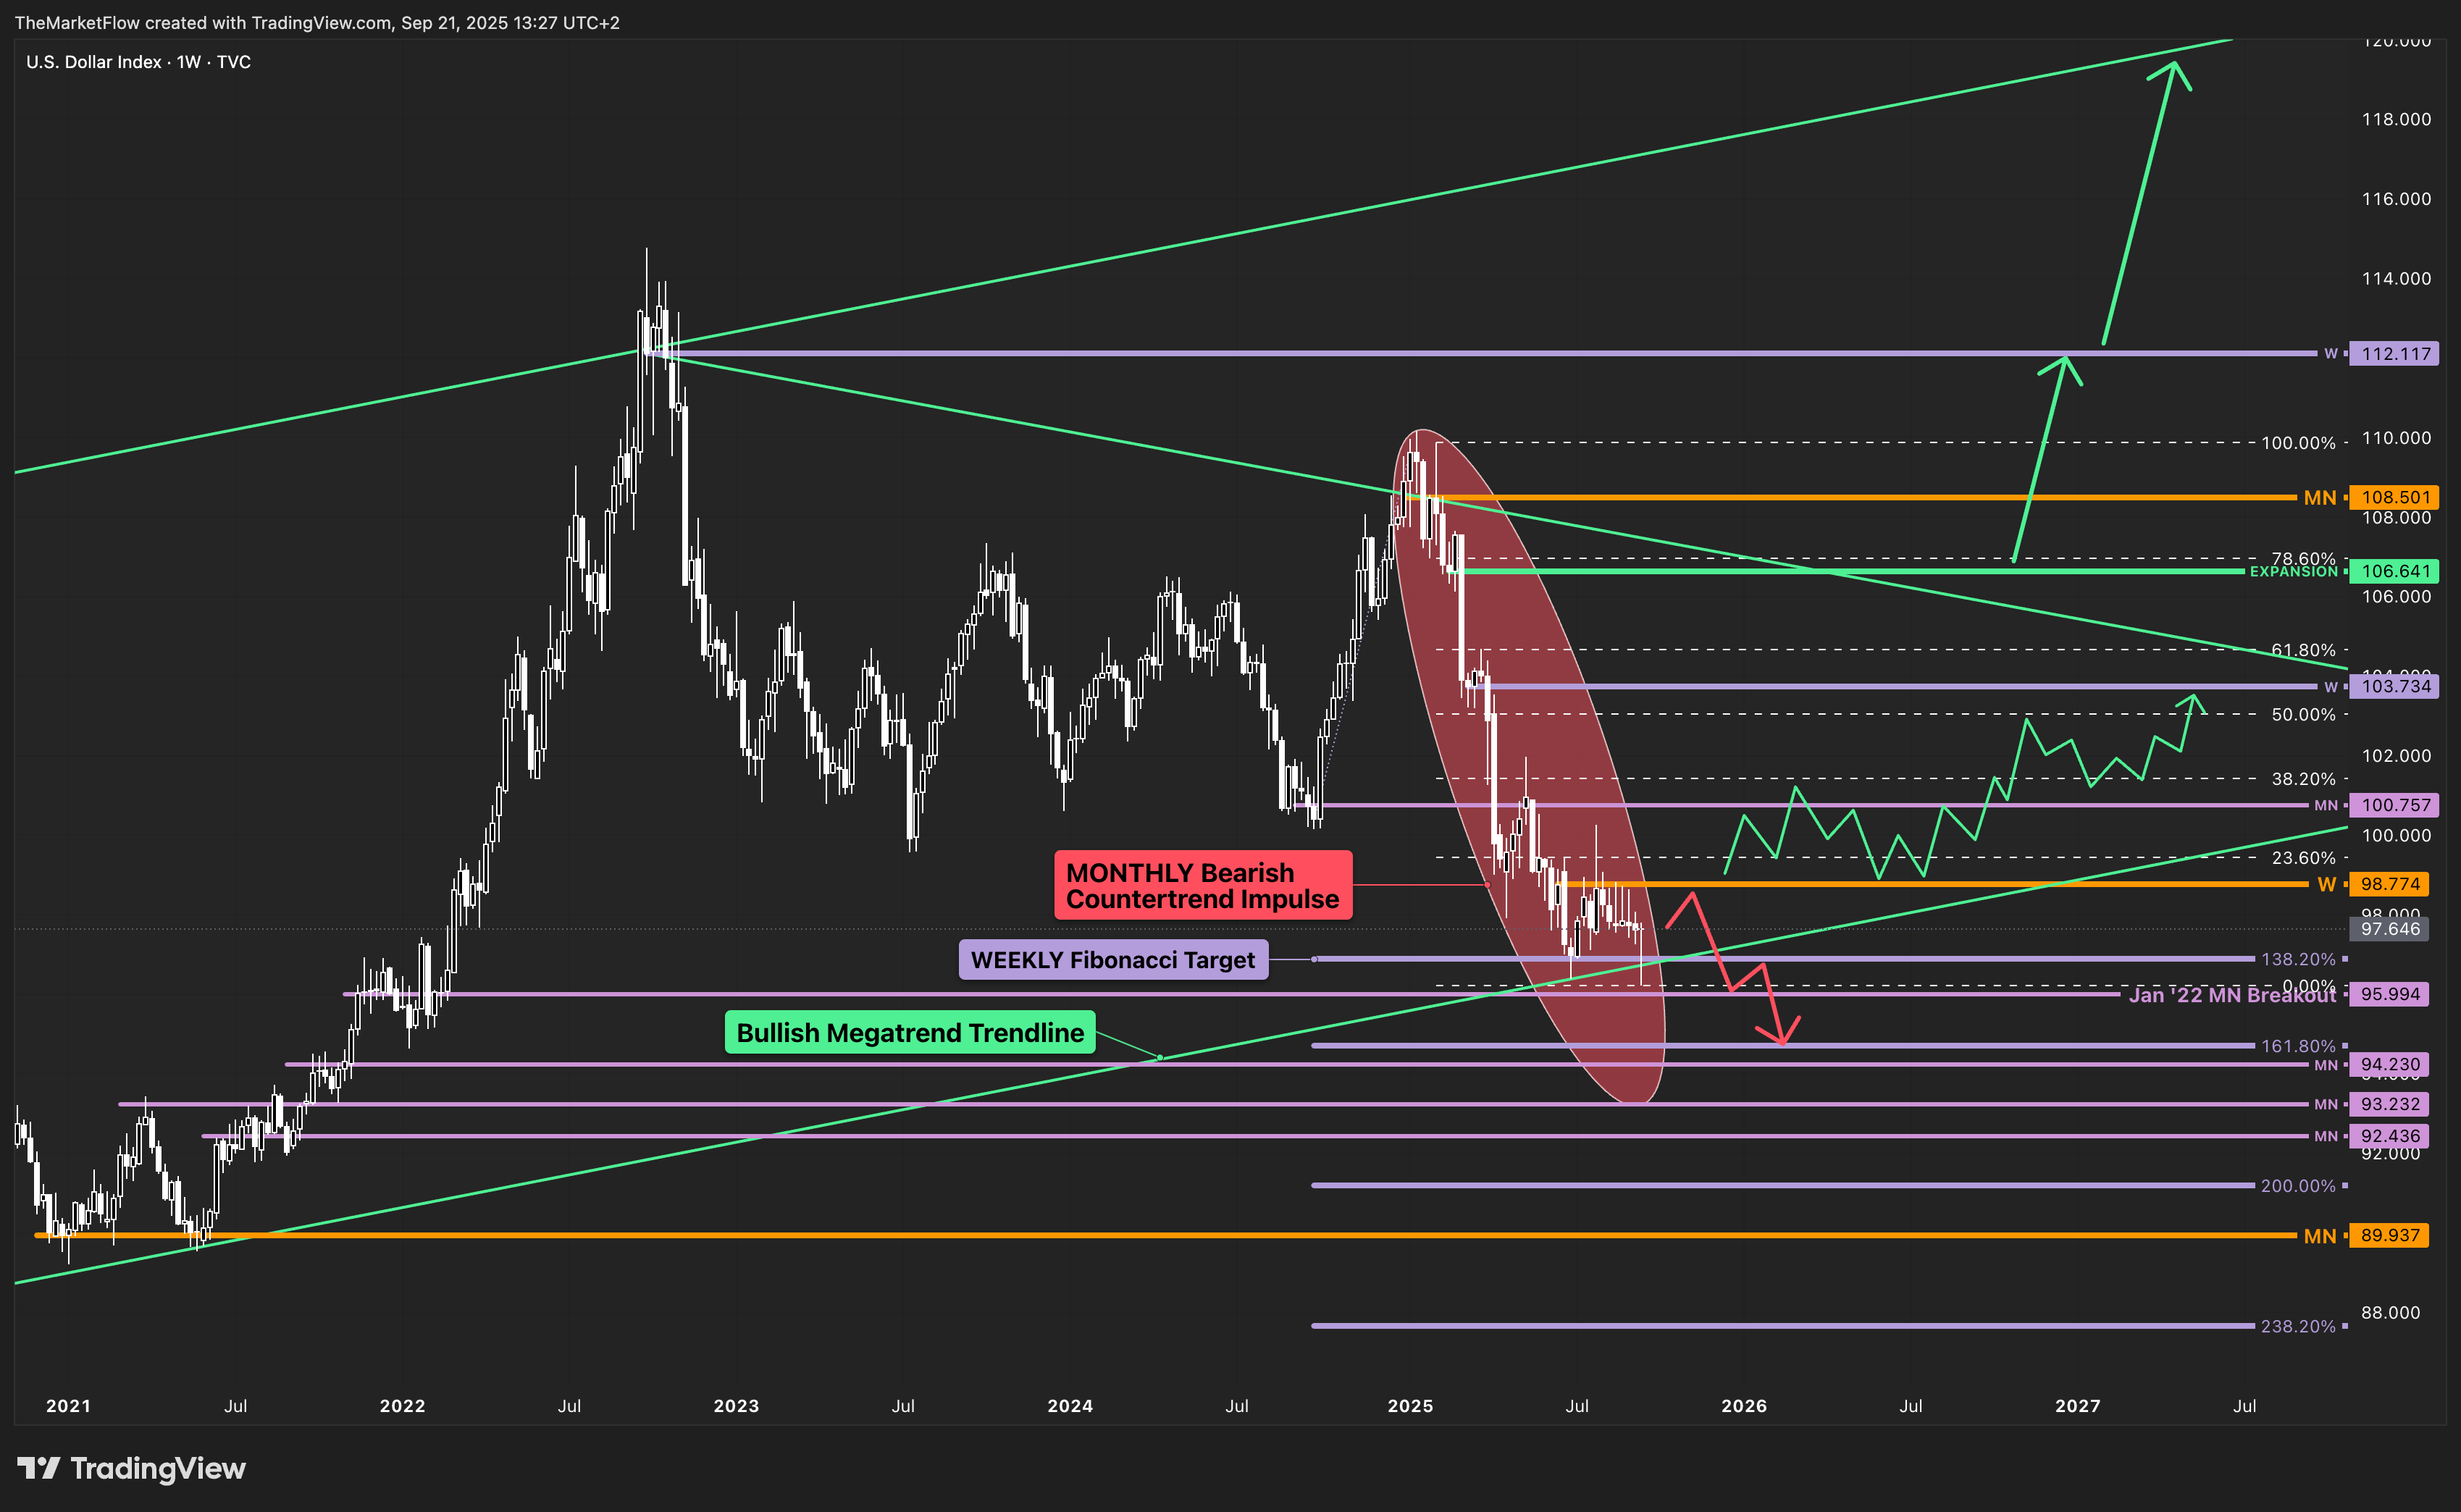
The last bearish impulse is highlighted and has already reached the weekly Fibonacci 138.2 target.
A significant monthly breakout from January 2022 has been approached but not yet tested. With this breakout, the market entered its expansion phase back in 2022.
A major long-term target zone has now been reached by the latest impulse.
Furthermore…
The previous candle formed a hammer at the target.
The pace of decline has clearly slowed.
The weekly pivot — the start of the last bearish impulse — has been touched, giving us a complete first and second leg in the potential reversal structure.
Implications
The impulse meeting a long-term target may trigger a countertrend move.
One more upward impulse would be enough to complete the reversal.
A significant break above the weekly pivot (98.774) would confirm the reversal on the weekly timeframe.
This would mean the bullish countertrend begins above the weekly pivot, targeting the Fibonacci 38.2–61.8 correction zone.
The bullish expansion of the primary megatrend resumes above the countertrend line break at the last untested breakdown of the previous bearish impulse.
If the weekly pivot holds, however, the bearish impulse may continue.