
NVIDIA Breaks Out Above Key Resistance – Is the Next Leg Up Underway?
Daily and Weekly Charts Align as The Break Above The Trigger Zone Validates Fibonacci Targets

NVIDIA (NVDA) has broken decisively above the descending countertrend line that had capped price action for months. This breakout occurs in confluence on both the daily and weekly charts, providing a strong technical foundation for a potential continuation move to the upside.
Daily Chart Highlights

Price has broken above the highest clean daily breakdown zone (~$139), signaling the end of the prior bearish wave structure.
The green descending trendline—representing the daily countertrend—has been clearly invalidated.
The bullish structure is forming higher highs and higher lows, with the recent impulsive wave reclaiming all local resistance levels.
Fibonacci extension targets are now active, starting from the 100% level ($148) and extending to the 138.2% level ($169) and 150%+ range.
Key invalidation level: The idea remains valid as long as price trades above the daily pivot (~$135.13).
Weekly Chart Context
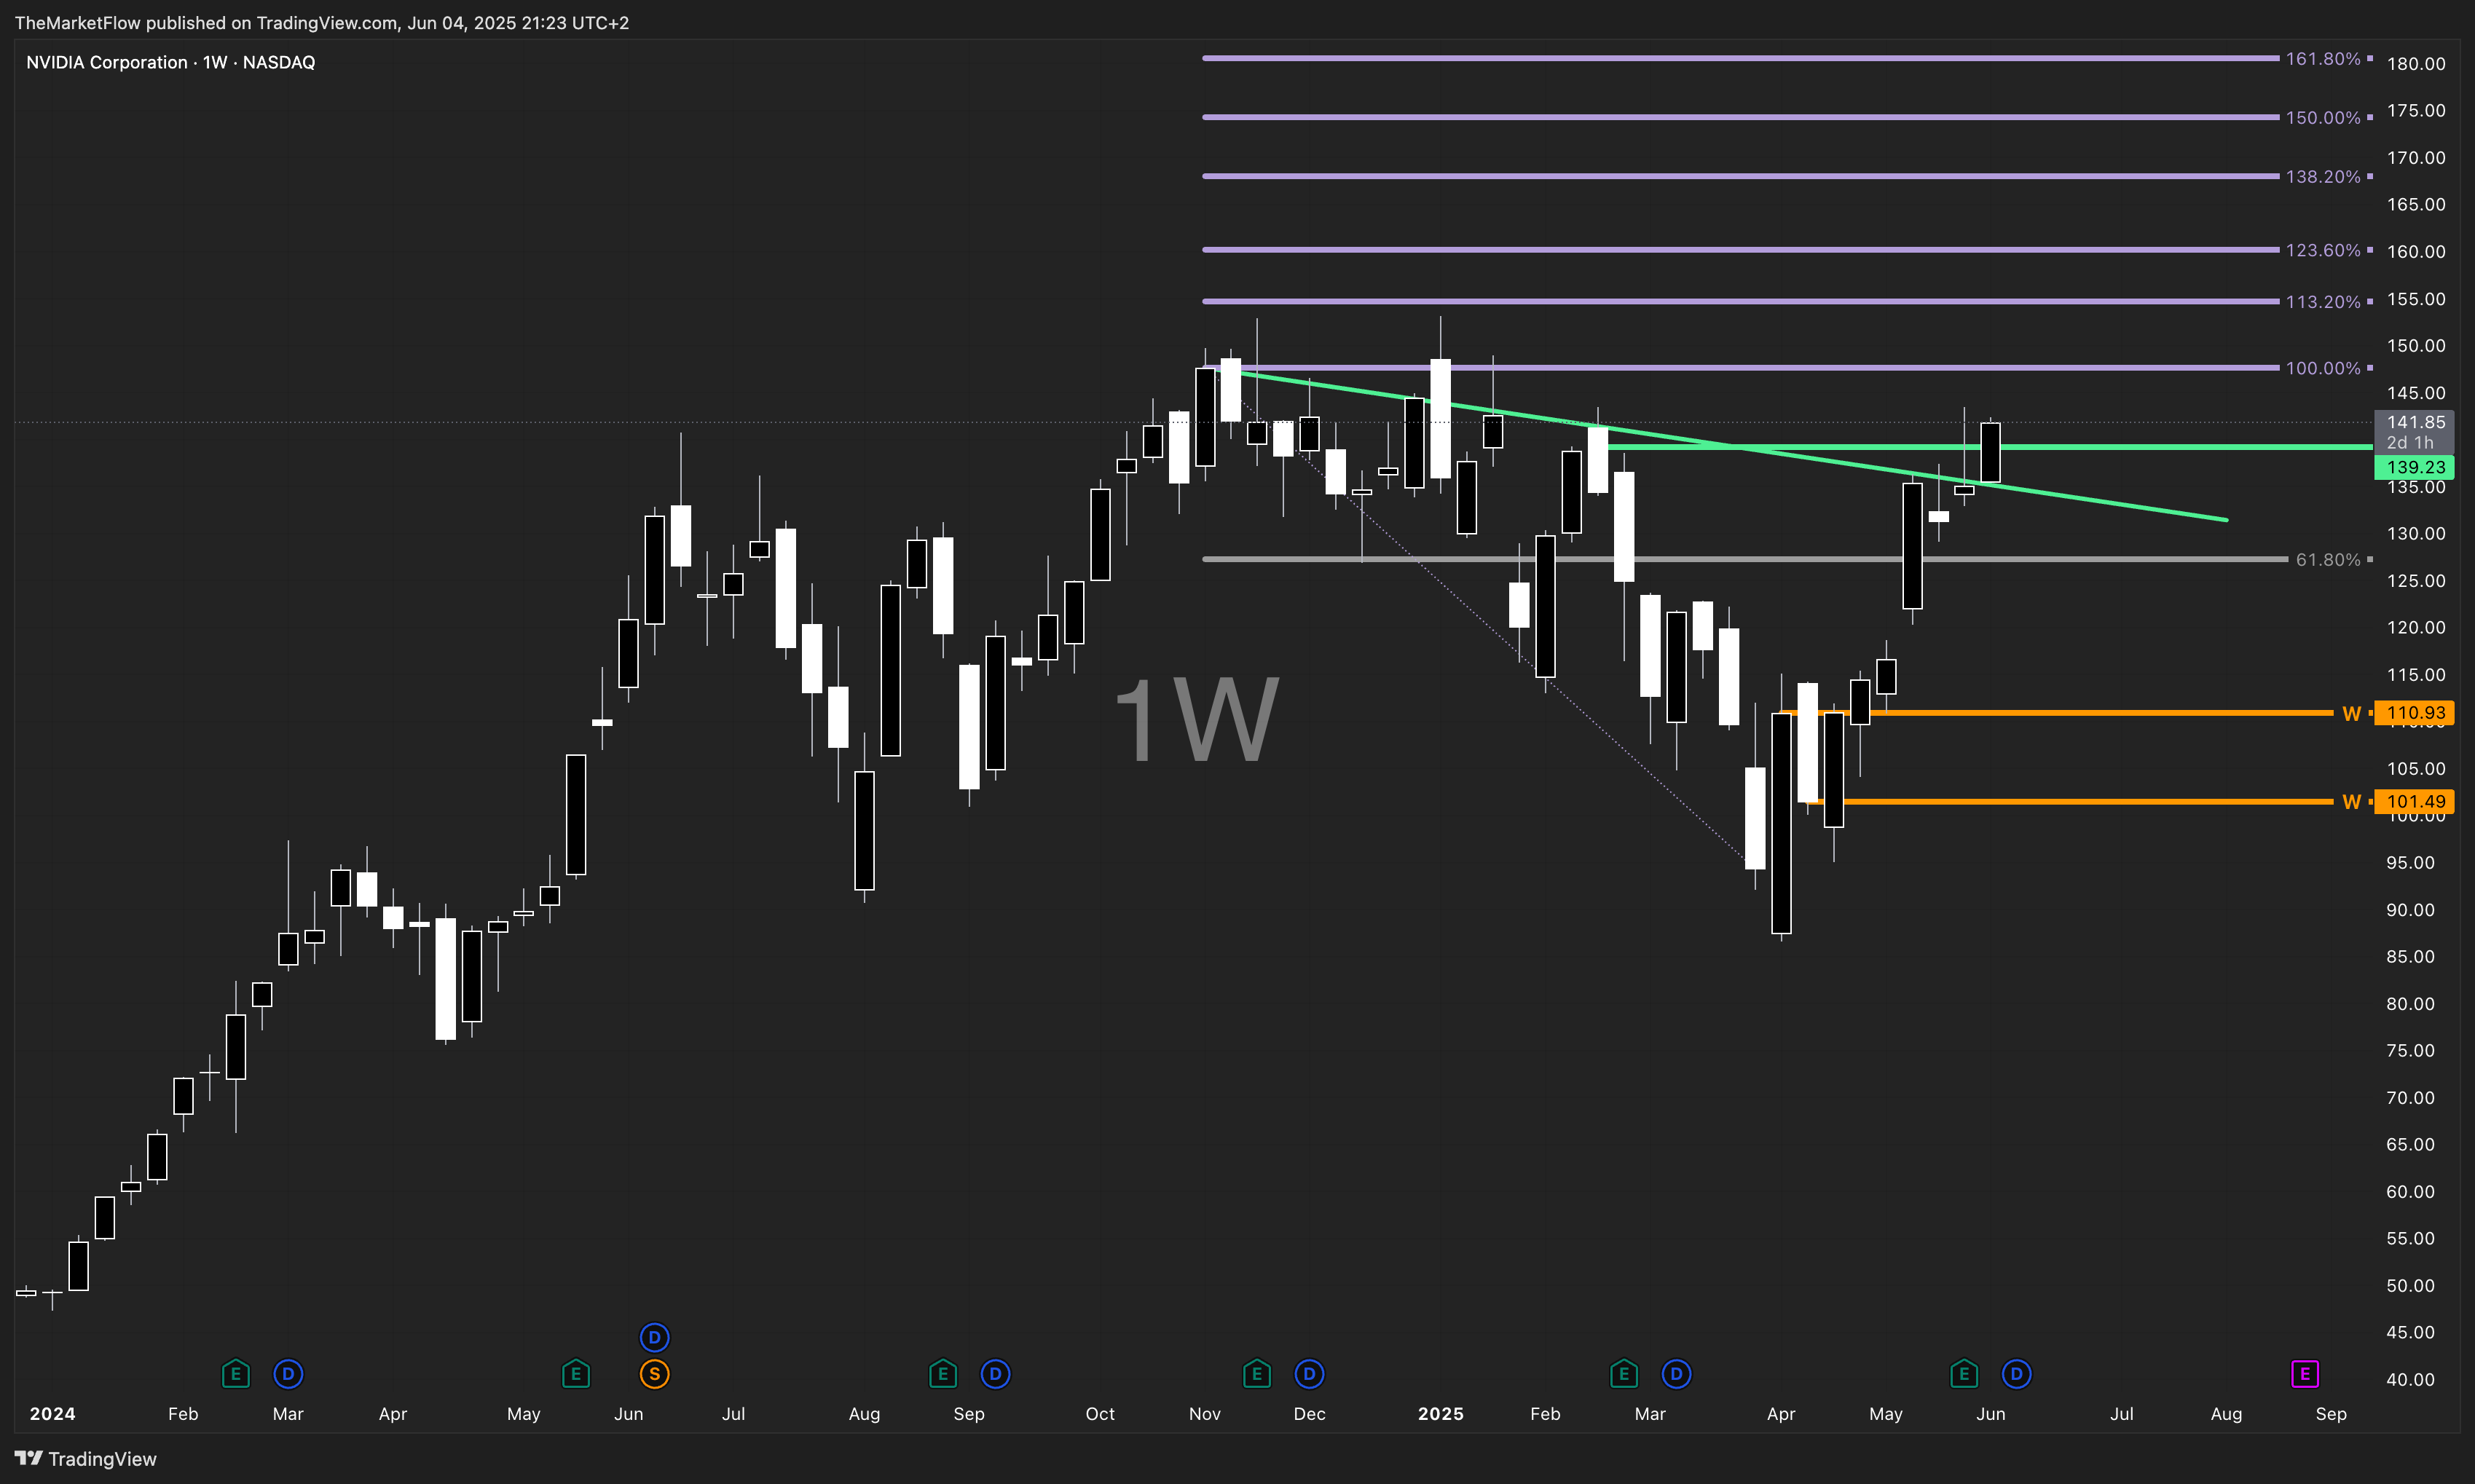
The breakout is visible on the weekly chart as well, with a strong bullish candle closing above the multi-month descending resistance line, however, the last candle is a moving candle.
This confirms a trend reversal on the intermediate time frame and activates higher timeframe Fibonacci targets.
Price is currently moving with momentum, and the weekly Fibonacci levels mirror those on the daily, providing high-confluence targets at:
113.2%: ~$156
123.6%: ~$160
138.2%: ~$169
150–161.8% range: ~$172–180
Conclusion
NVIDIA has entered a bullish expansion phase after clearing its most significant resistance cluster around $139. The alignment of daily and weekly trend breaks, alongside multiple active Fibonacci targets, supports the bullish continuation thesis.
As long as the market remains above the $135 daily pivot, the upside targets toward $169–172 remain valid.