
NASDAQ – Awaiting Alignment for Bullish Expansion
Substantial long-term strength challenged by the daily pivot test

Market Overview
The US100 index continues to display bullish tendencies, with the weekly chart indicating a strong long-term upward trajectory toward all-time highs and defined Fibonacci extension targets. The recent corrective moves on the daily timeframe remain contained above pivotal support, setting up conditions for potential bullish continuation.
Weekly Structure
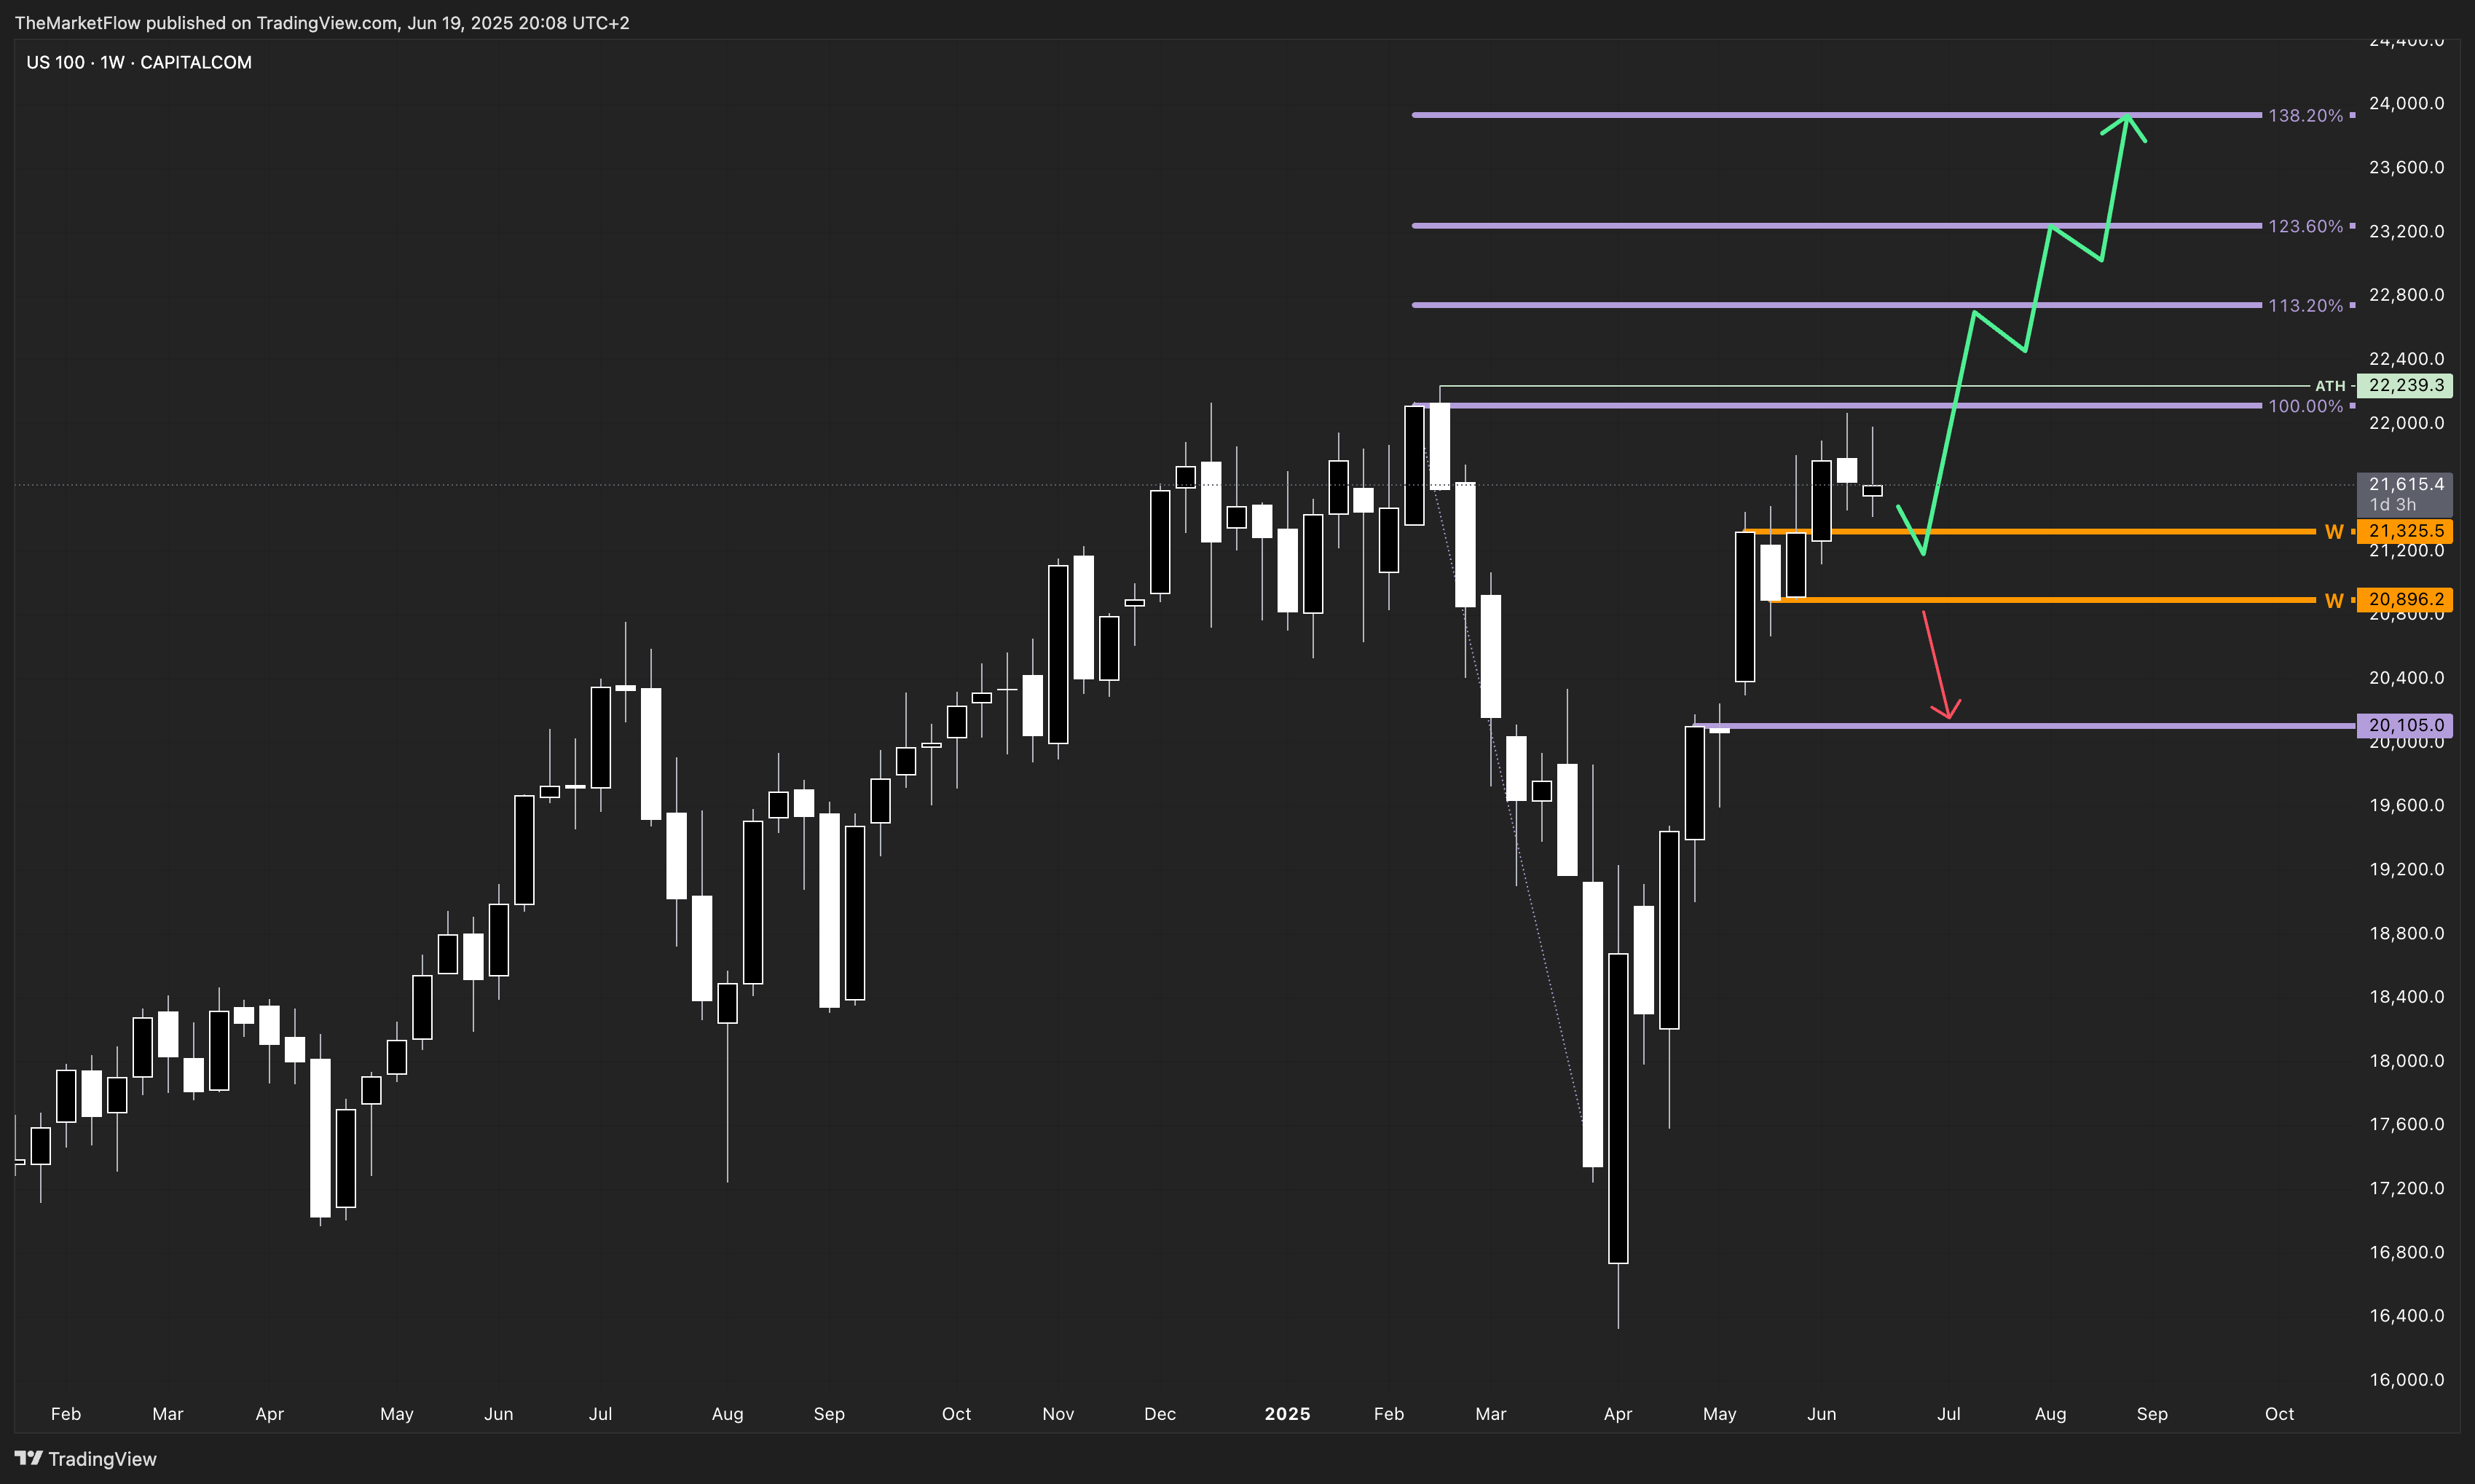
The weekly timeframe clearly demonstrates the long-term bullish structure, approaching critical Fibonacci target zones, including the notable 138.2% extension level. Price recently maintained strength above weekly pivot zones around 21,325.5 and 20,896.2, reinforcing the integrity of the prevailing bullish structure.
Daily Chart
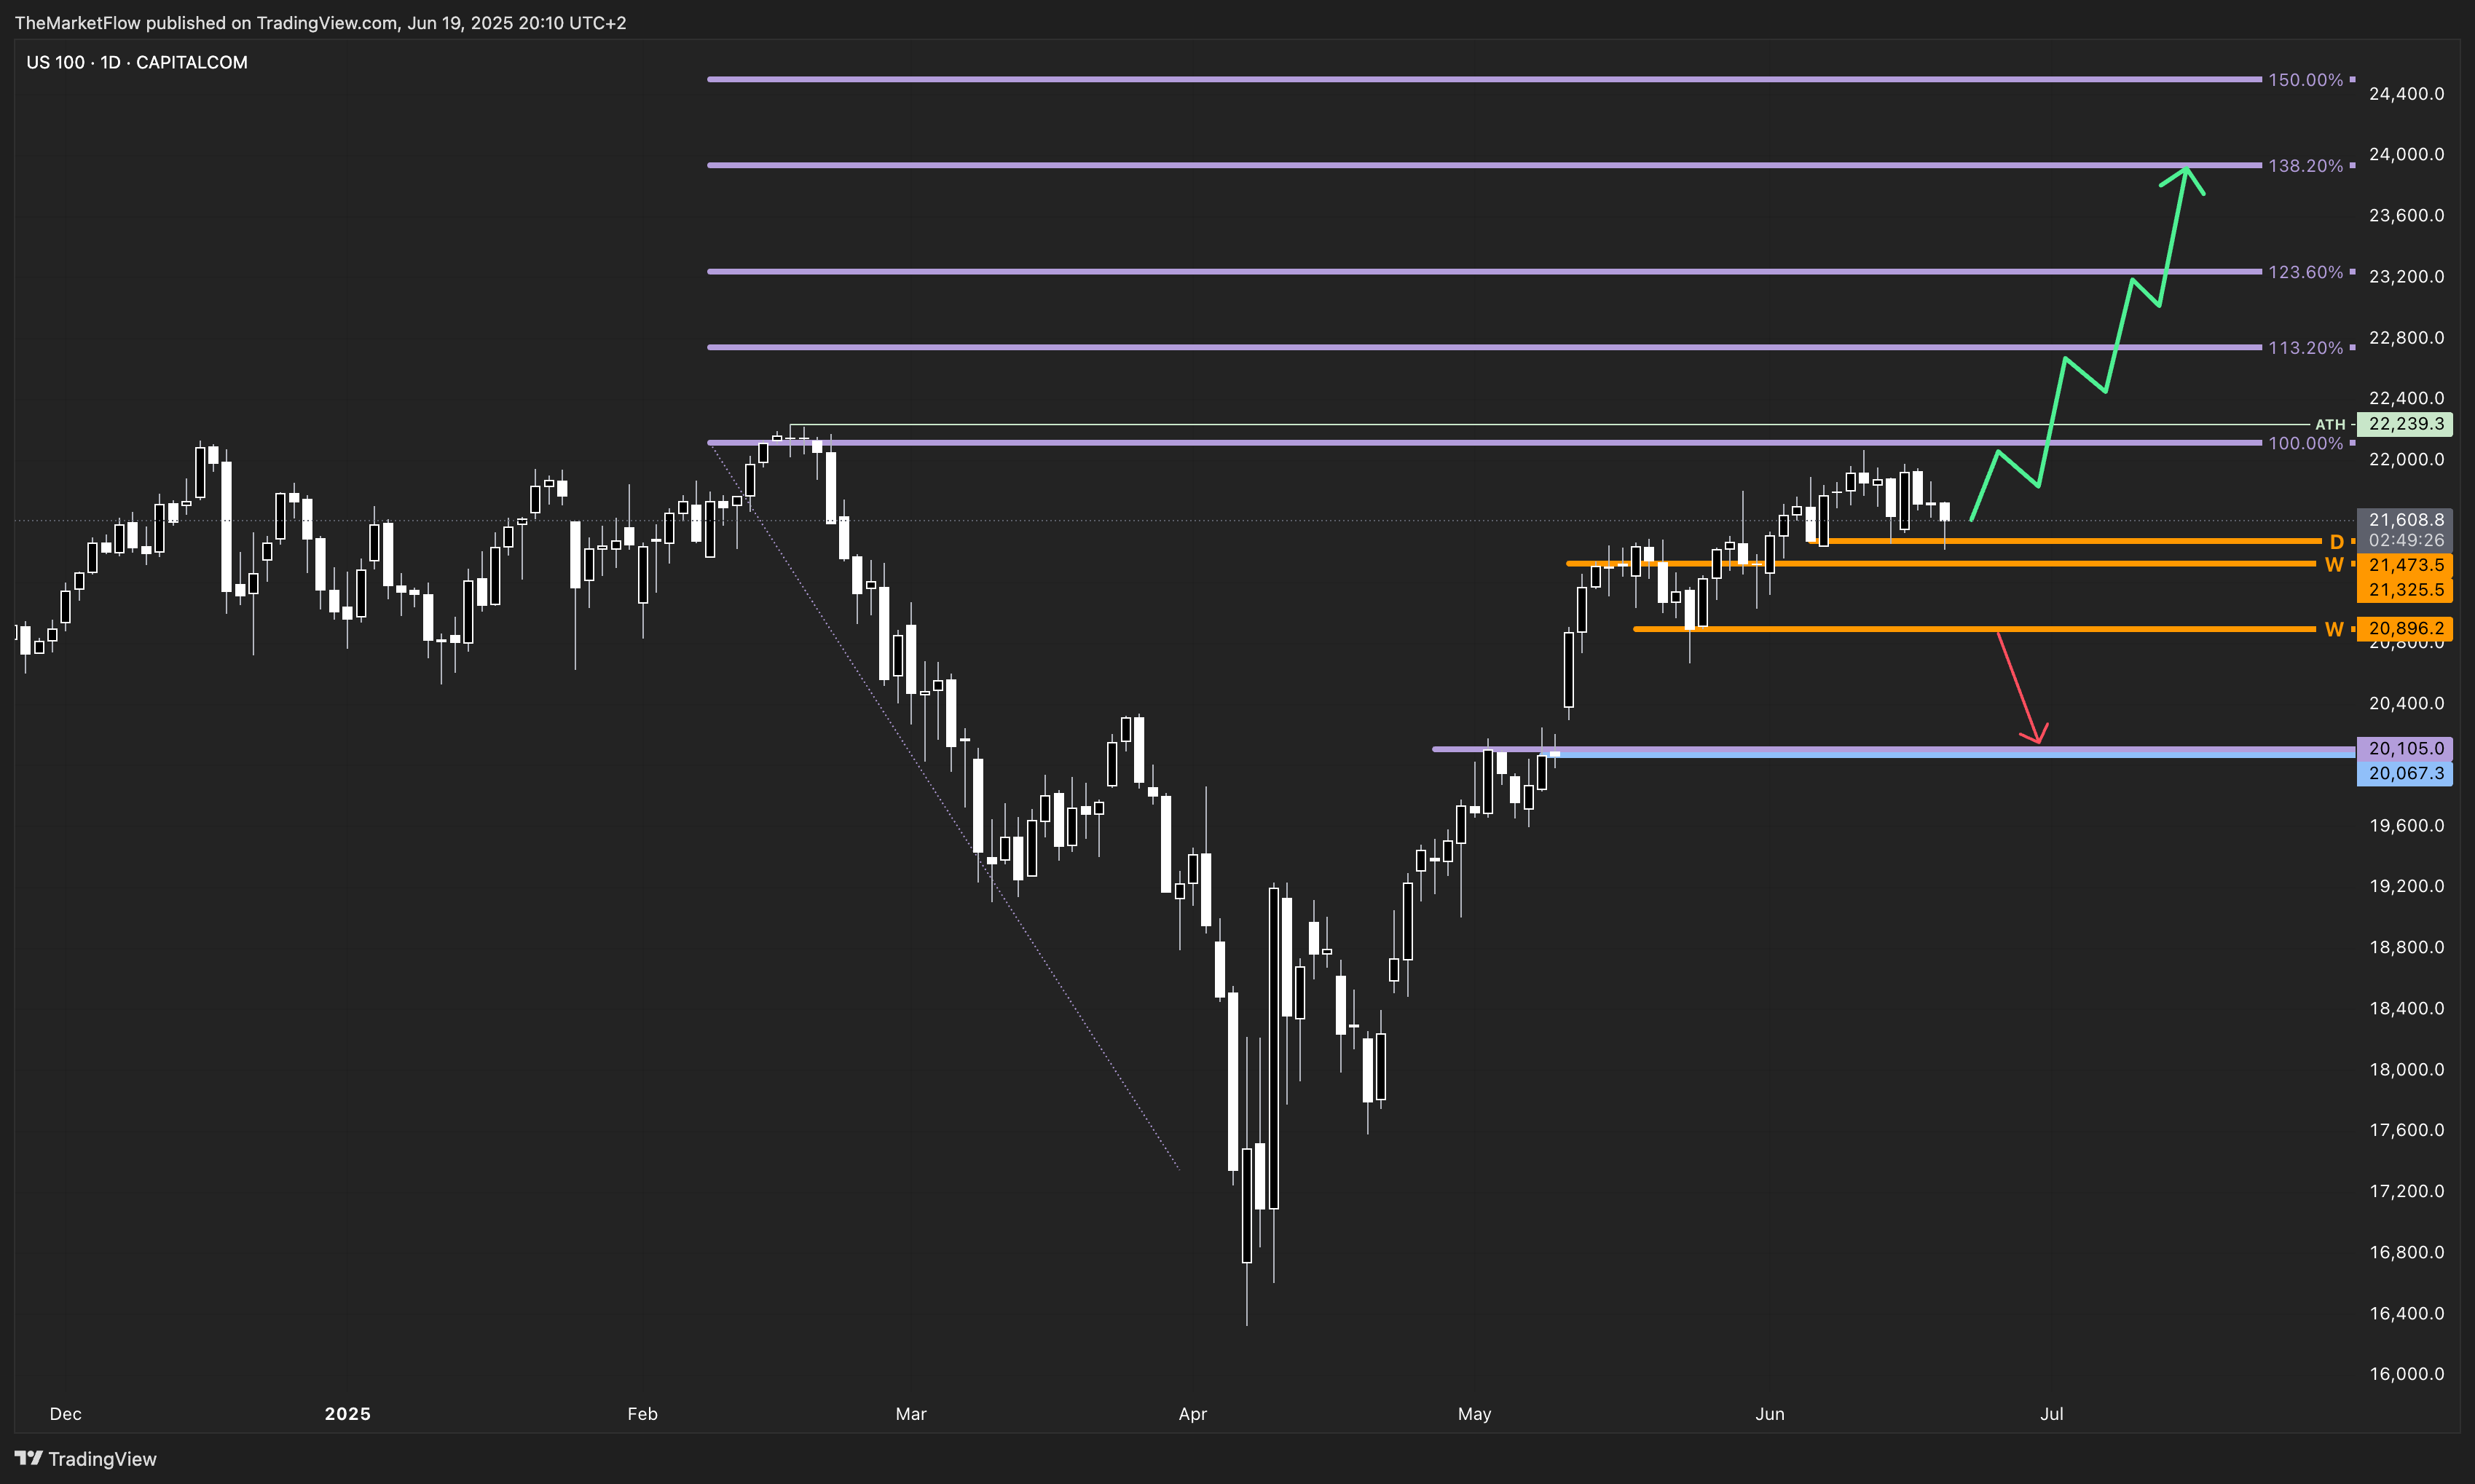
The daily trend remains bullish despite recent corrective moves. Price action successfully rejected a critical daily pivot at 21,473.5, signaling that underlying bullish momentum is still present. Maintaining this pivot as support remains crucial for bullish continuation.
H4 Timeframe
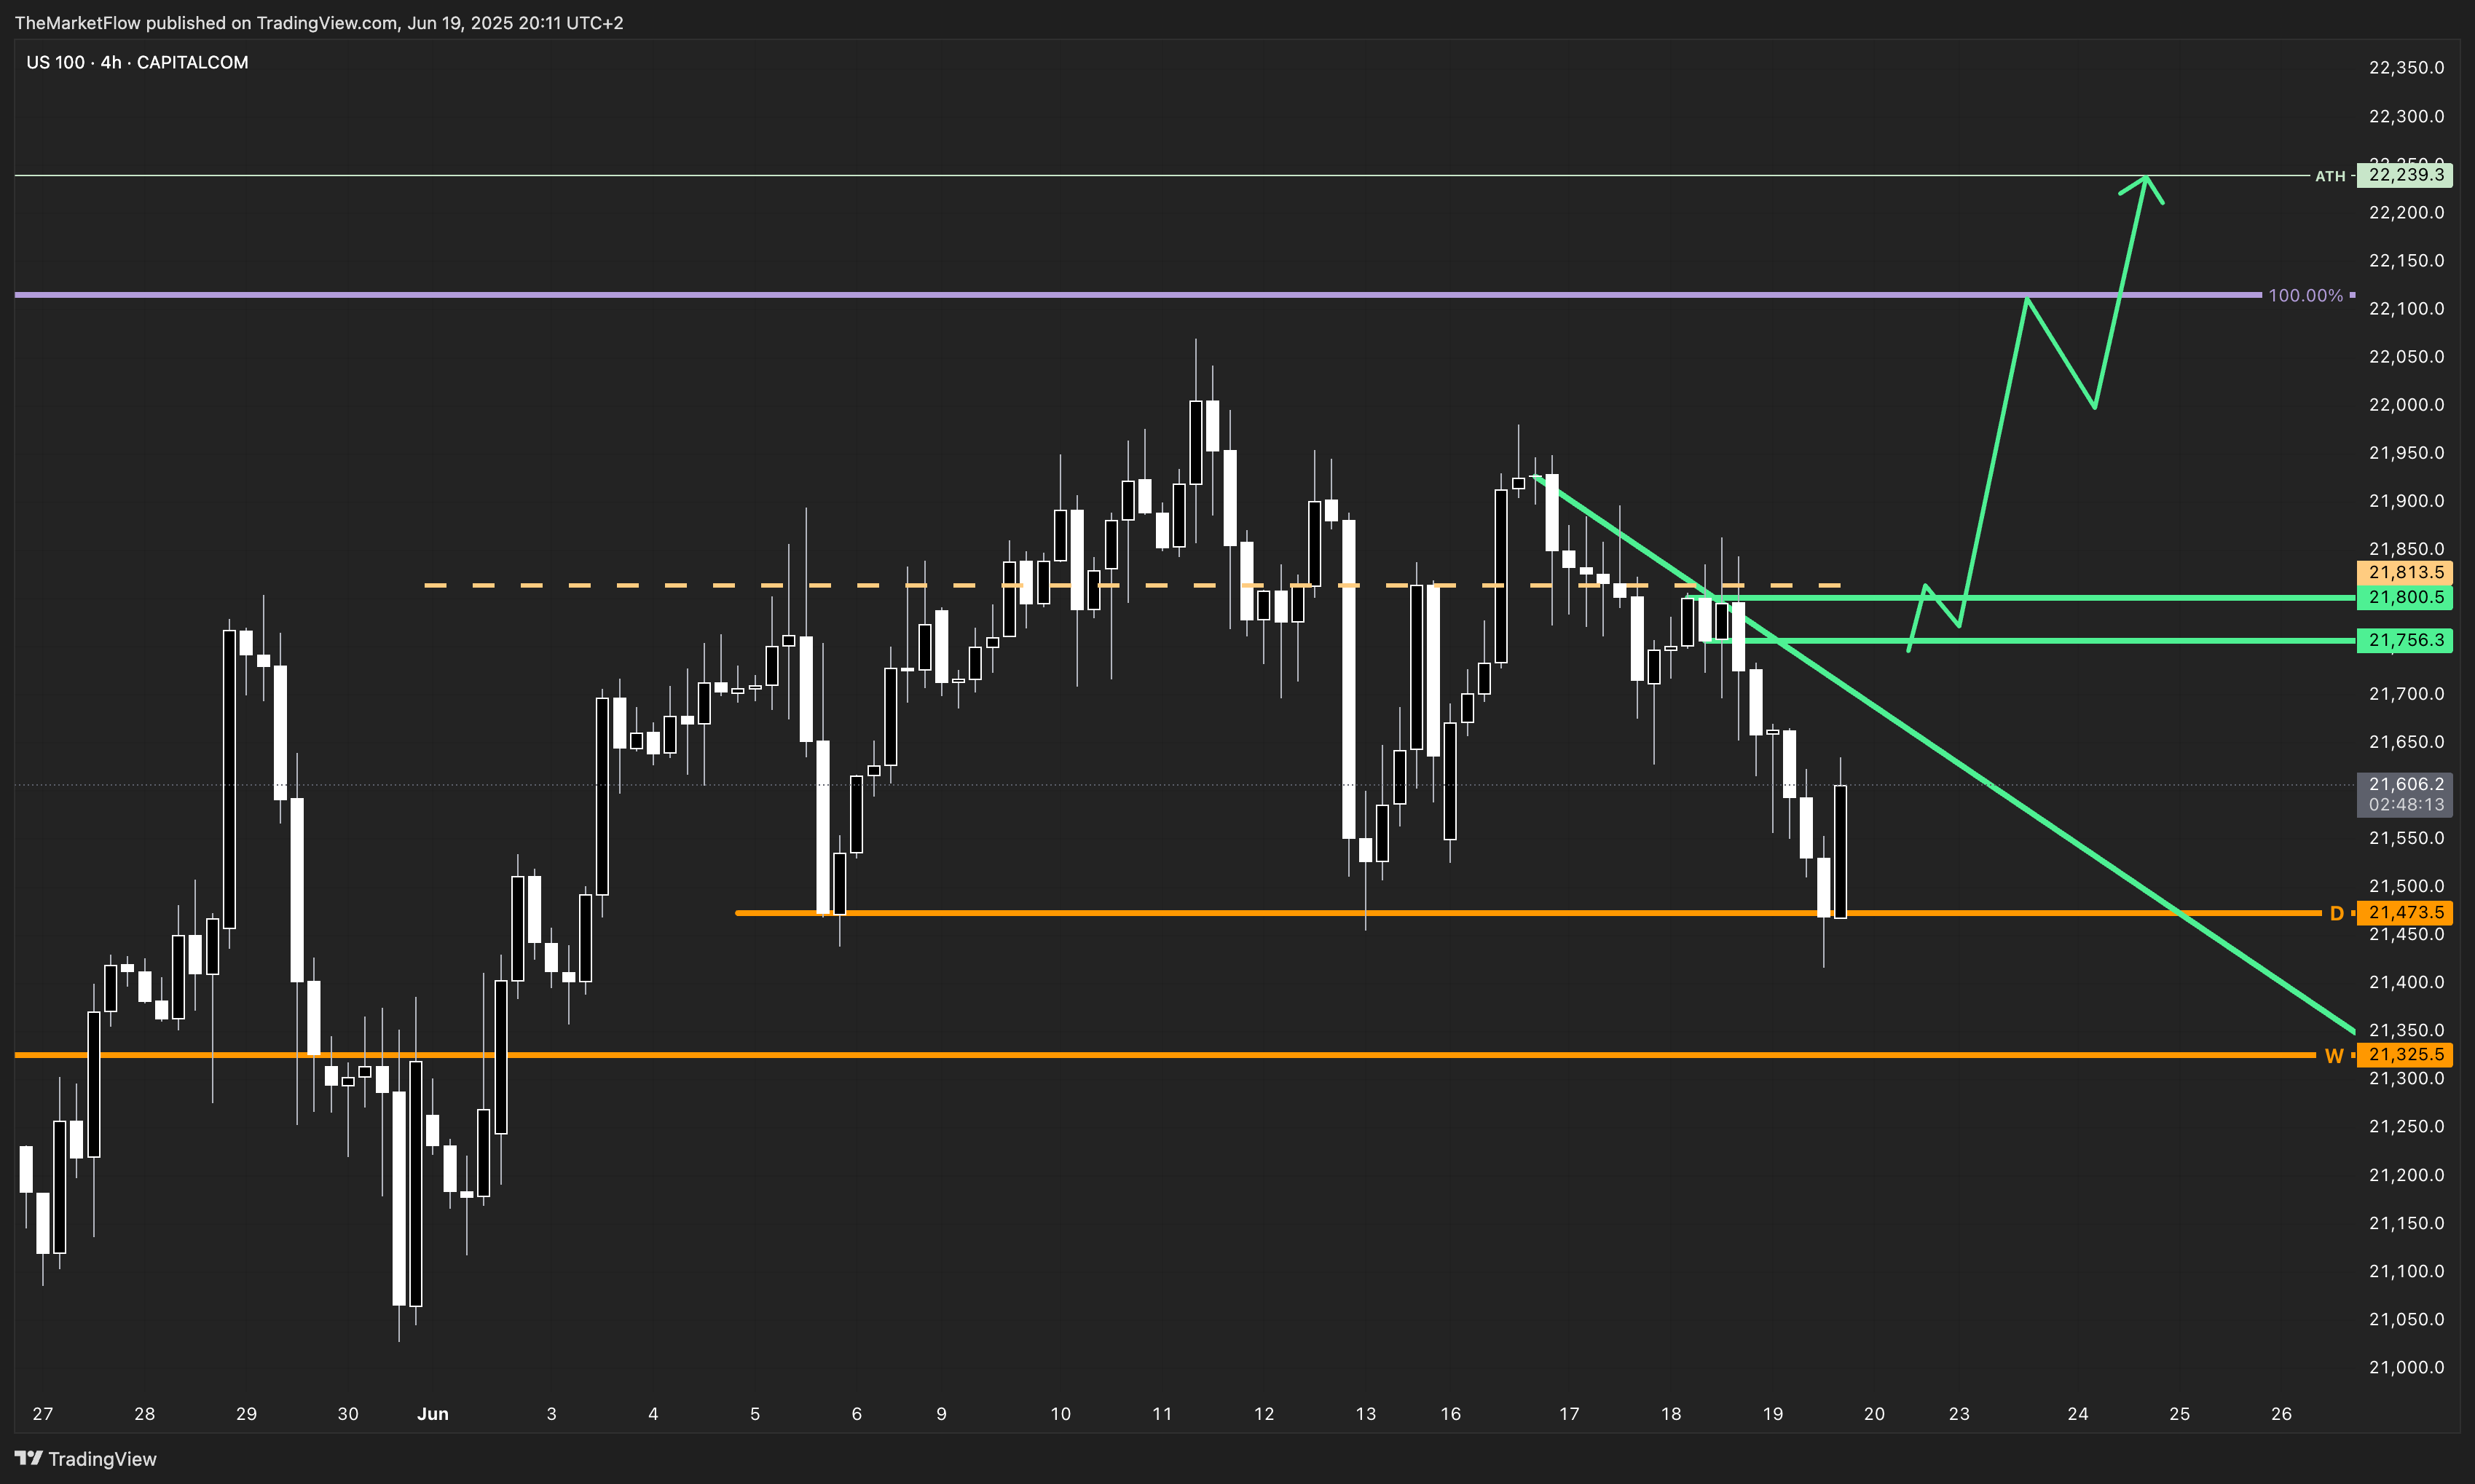
The 4-hour chart is currently showing a clear potential turning point at the green trigger zone, specifically around the 21,756.3 - 21,800.5 area. Breaking through the descending short-term countertrend line would validate bullish alignment, syncing lower timeframes with higher timeframe bullish sentiment.
Key Levels
Green Trigger Zone (Long Confirmation): 21,756.3 - 21,80.5 (H4)
Daily Pivot (Critical Support): 21,473.5
Weekly Pivot Zone (Macro Support Zone): 21,325.5 & 20,896.2
Target Zones
All-Time High: 22,239.3
Weekly Fibonacci Extensions: Up to 138.2% at approximately 24,000 (potential long-term objective)
Validity
The bullish scenario remains valid above the daily pivot at 21,473.5. A clear breakdown of this level would signal potential deeper corrections, potentially testing the weekly support levels.
Conclusion
The current structure presents a compelling setup for potential bullish continuation. Confirmation will come with a break of the short-term H4 countertrend line and the trigger zone, bringing alignment across weekly, daily, and intraday timeframes for a robust bullish expansion.
Actionable Insight
Watch the H4 green trigger zone closely—confirmation here could set off the next bullish leg toward all-time highs and weekly Fibonacci targets.
How are you interpreting this alignment on Tech Index? Share your views in the comments—let’s discuss potential strategies.