
MSCI | Multi-Timeframe Expansion Alignment Toward 660–760 Zone
Countertrend break confirmed by waves; correction expected before continuation toward monthly Fibonacci targets.

The Market Flow | November 4, 2025
Company Overview
MSCI Inc. provides critical decision-support tools for the global investment community. Its products include indexes, portfolio analytics, ESG and climate data, and risk management software used by asset managers and institutional investors worldwide. Revenue is primarily subscription-based, offering stable recurring income across its four main segments: Index, Analytics, ESG & Climate, and Real Estate.
MSCI fits the stalwart category — a mature, high-margin data and analytics company with steady revenue growth and resilient market positioning supported by long-term demand for passive investment products and ESG integration.
Technical Overview
Monthly
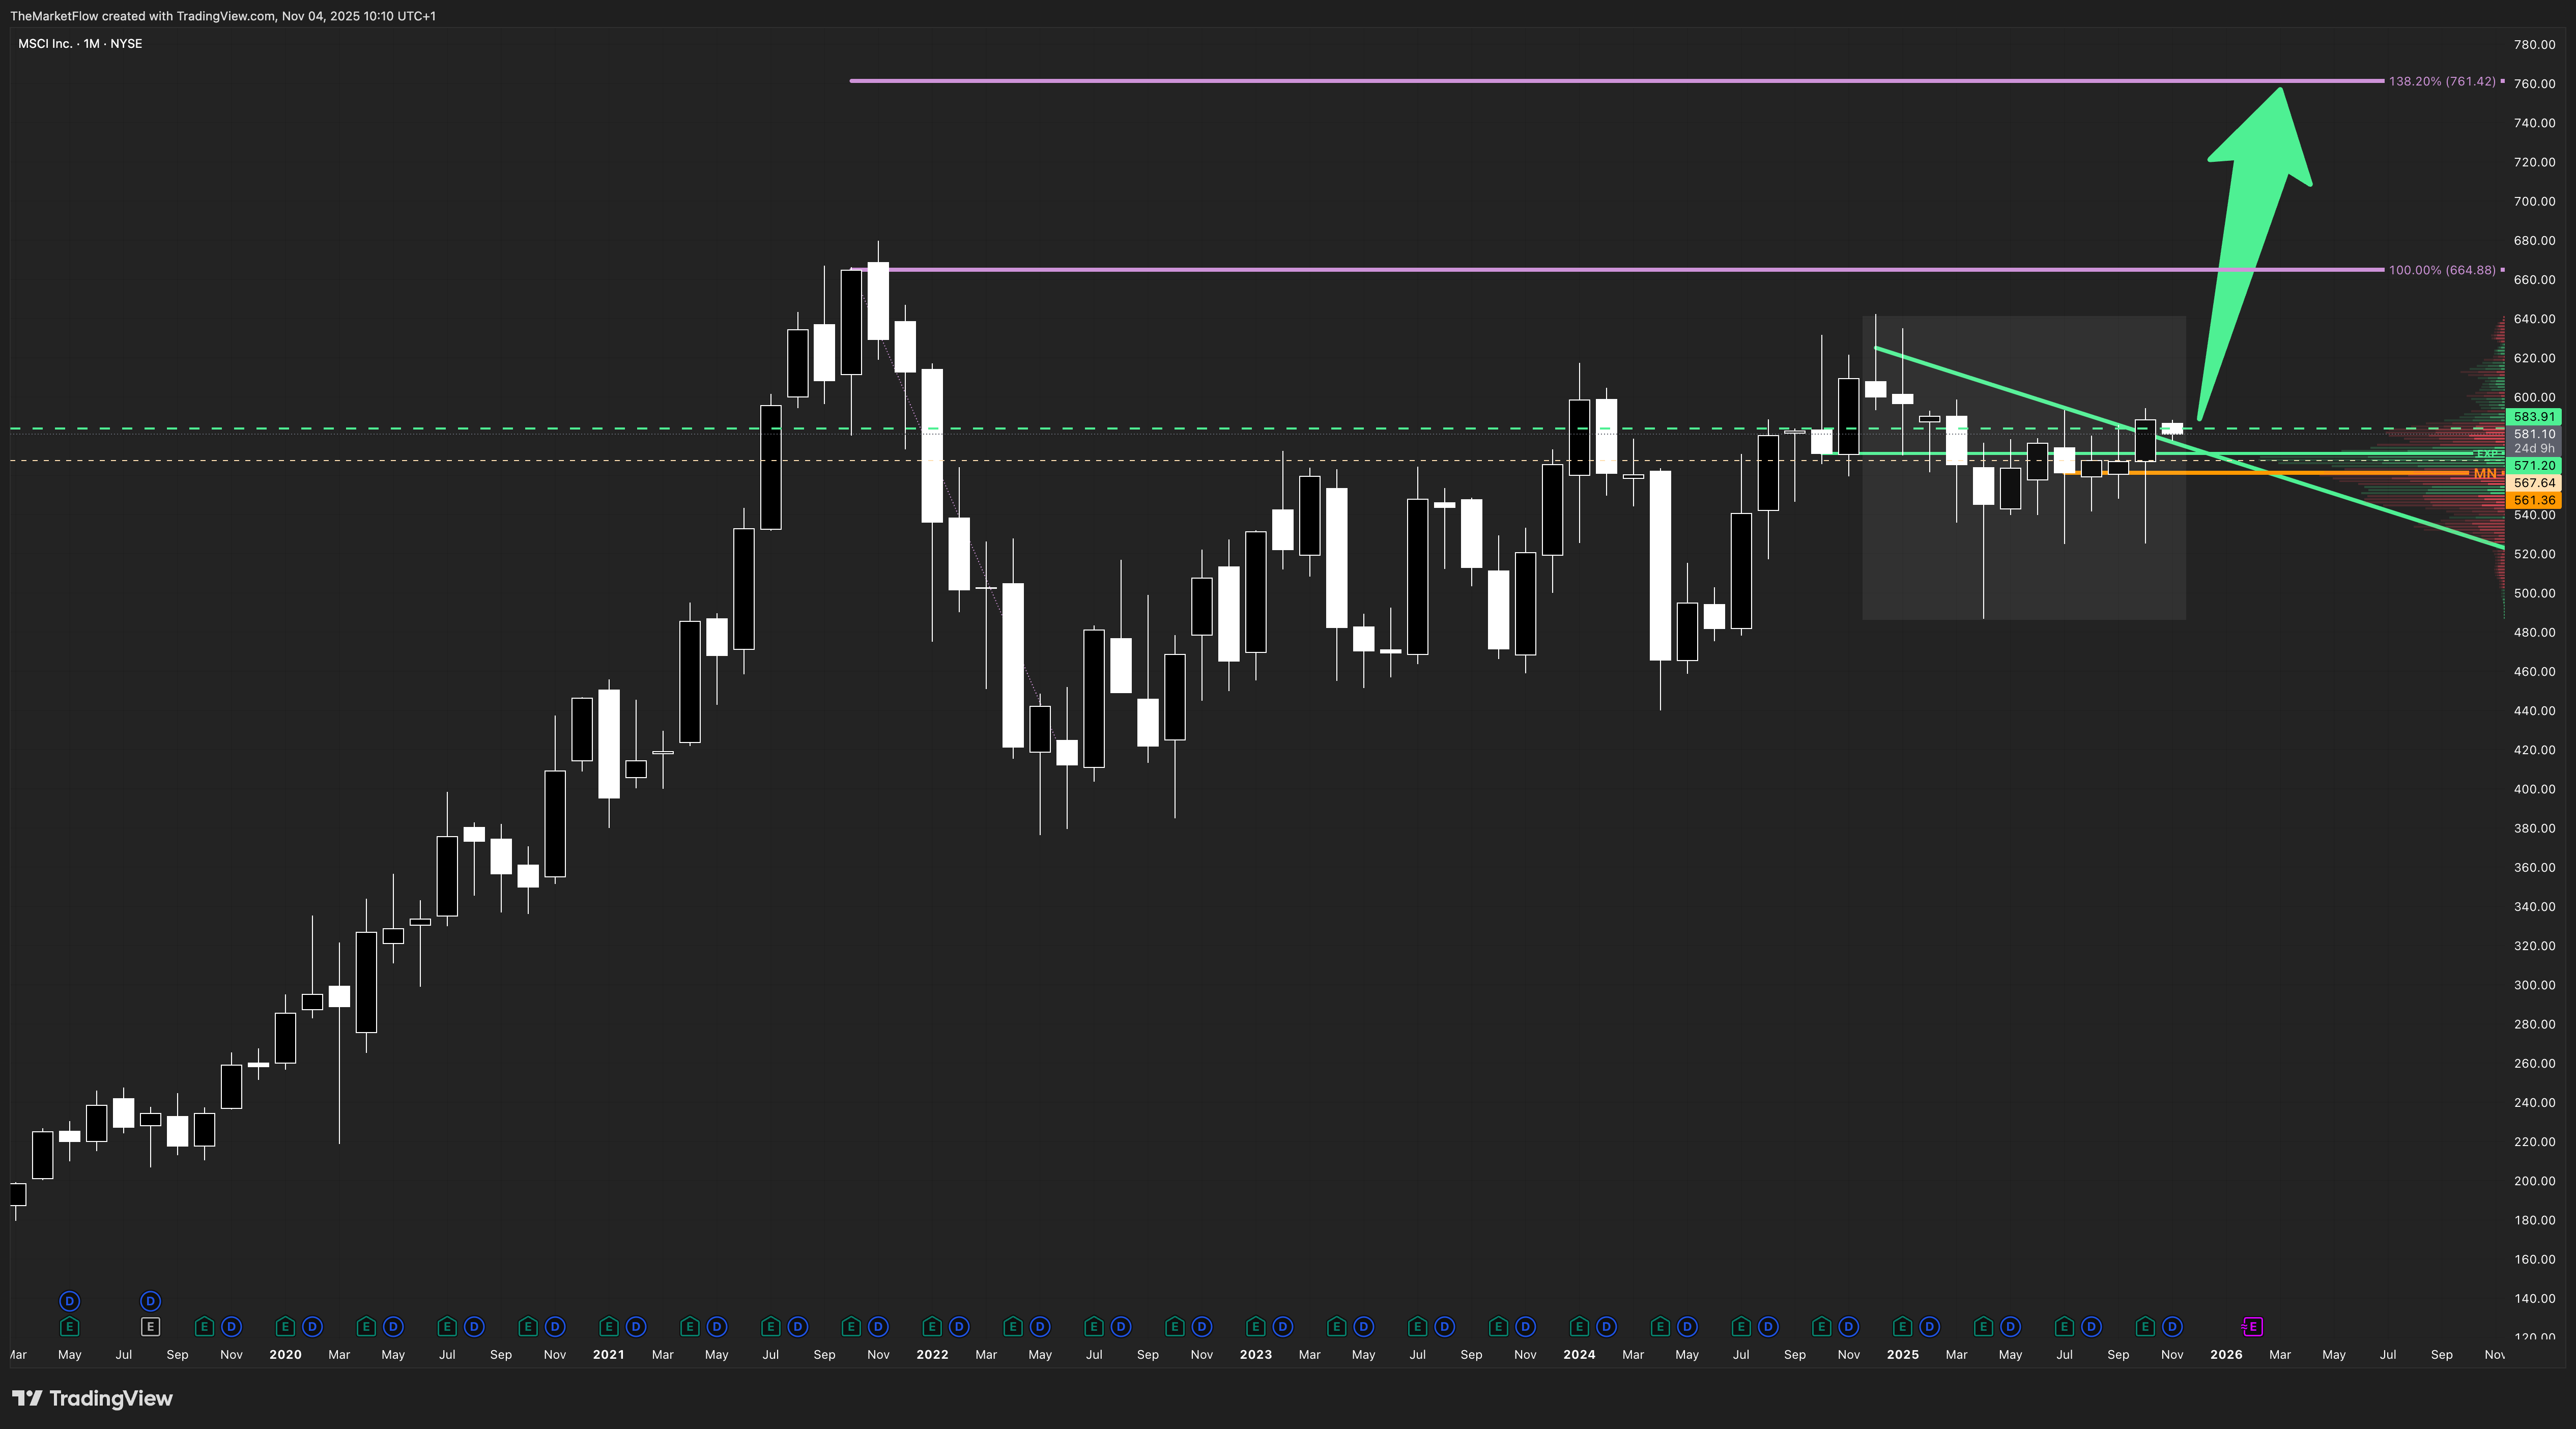
The countertrend structure has been decisively broken by wave alignment, clearing the highest clean breakdown (EXP) level. Price closed above the green countertrend and the Value Area High at 583.91, confirming structural breakout. The long-term expansion path points toward the 664–670 zone (monthly 100%–weekly 138.2%), followed by potential continuation toward the 761.42 Fibonacci extension. The expansion phase is active as long as the 561.36 monthly pivot holds as structural invalidation.
Weekly
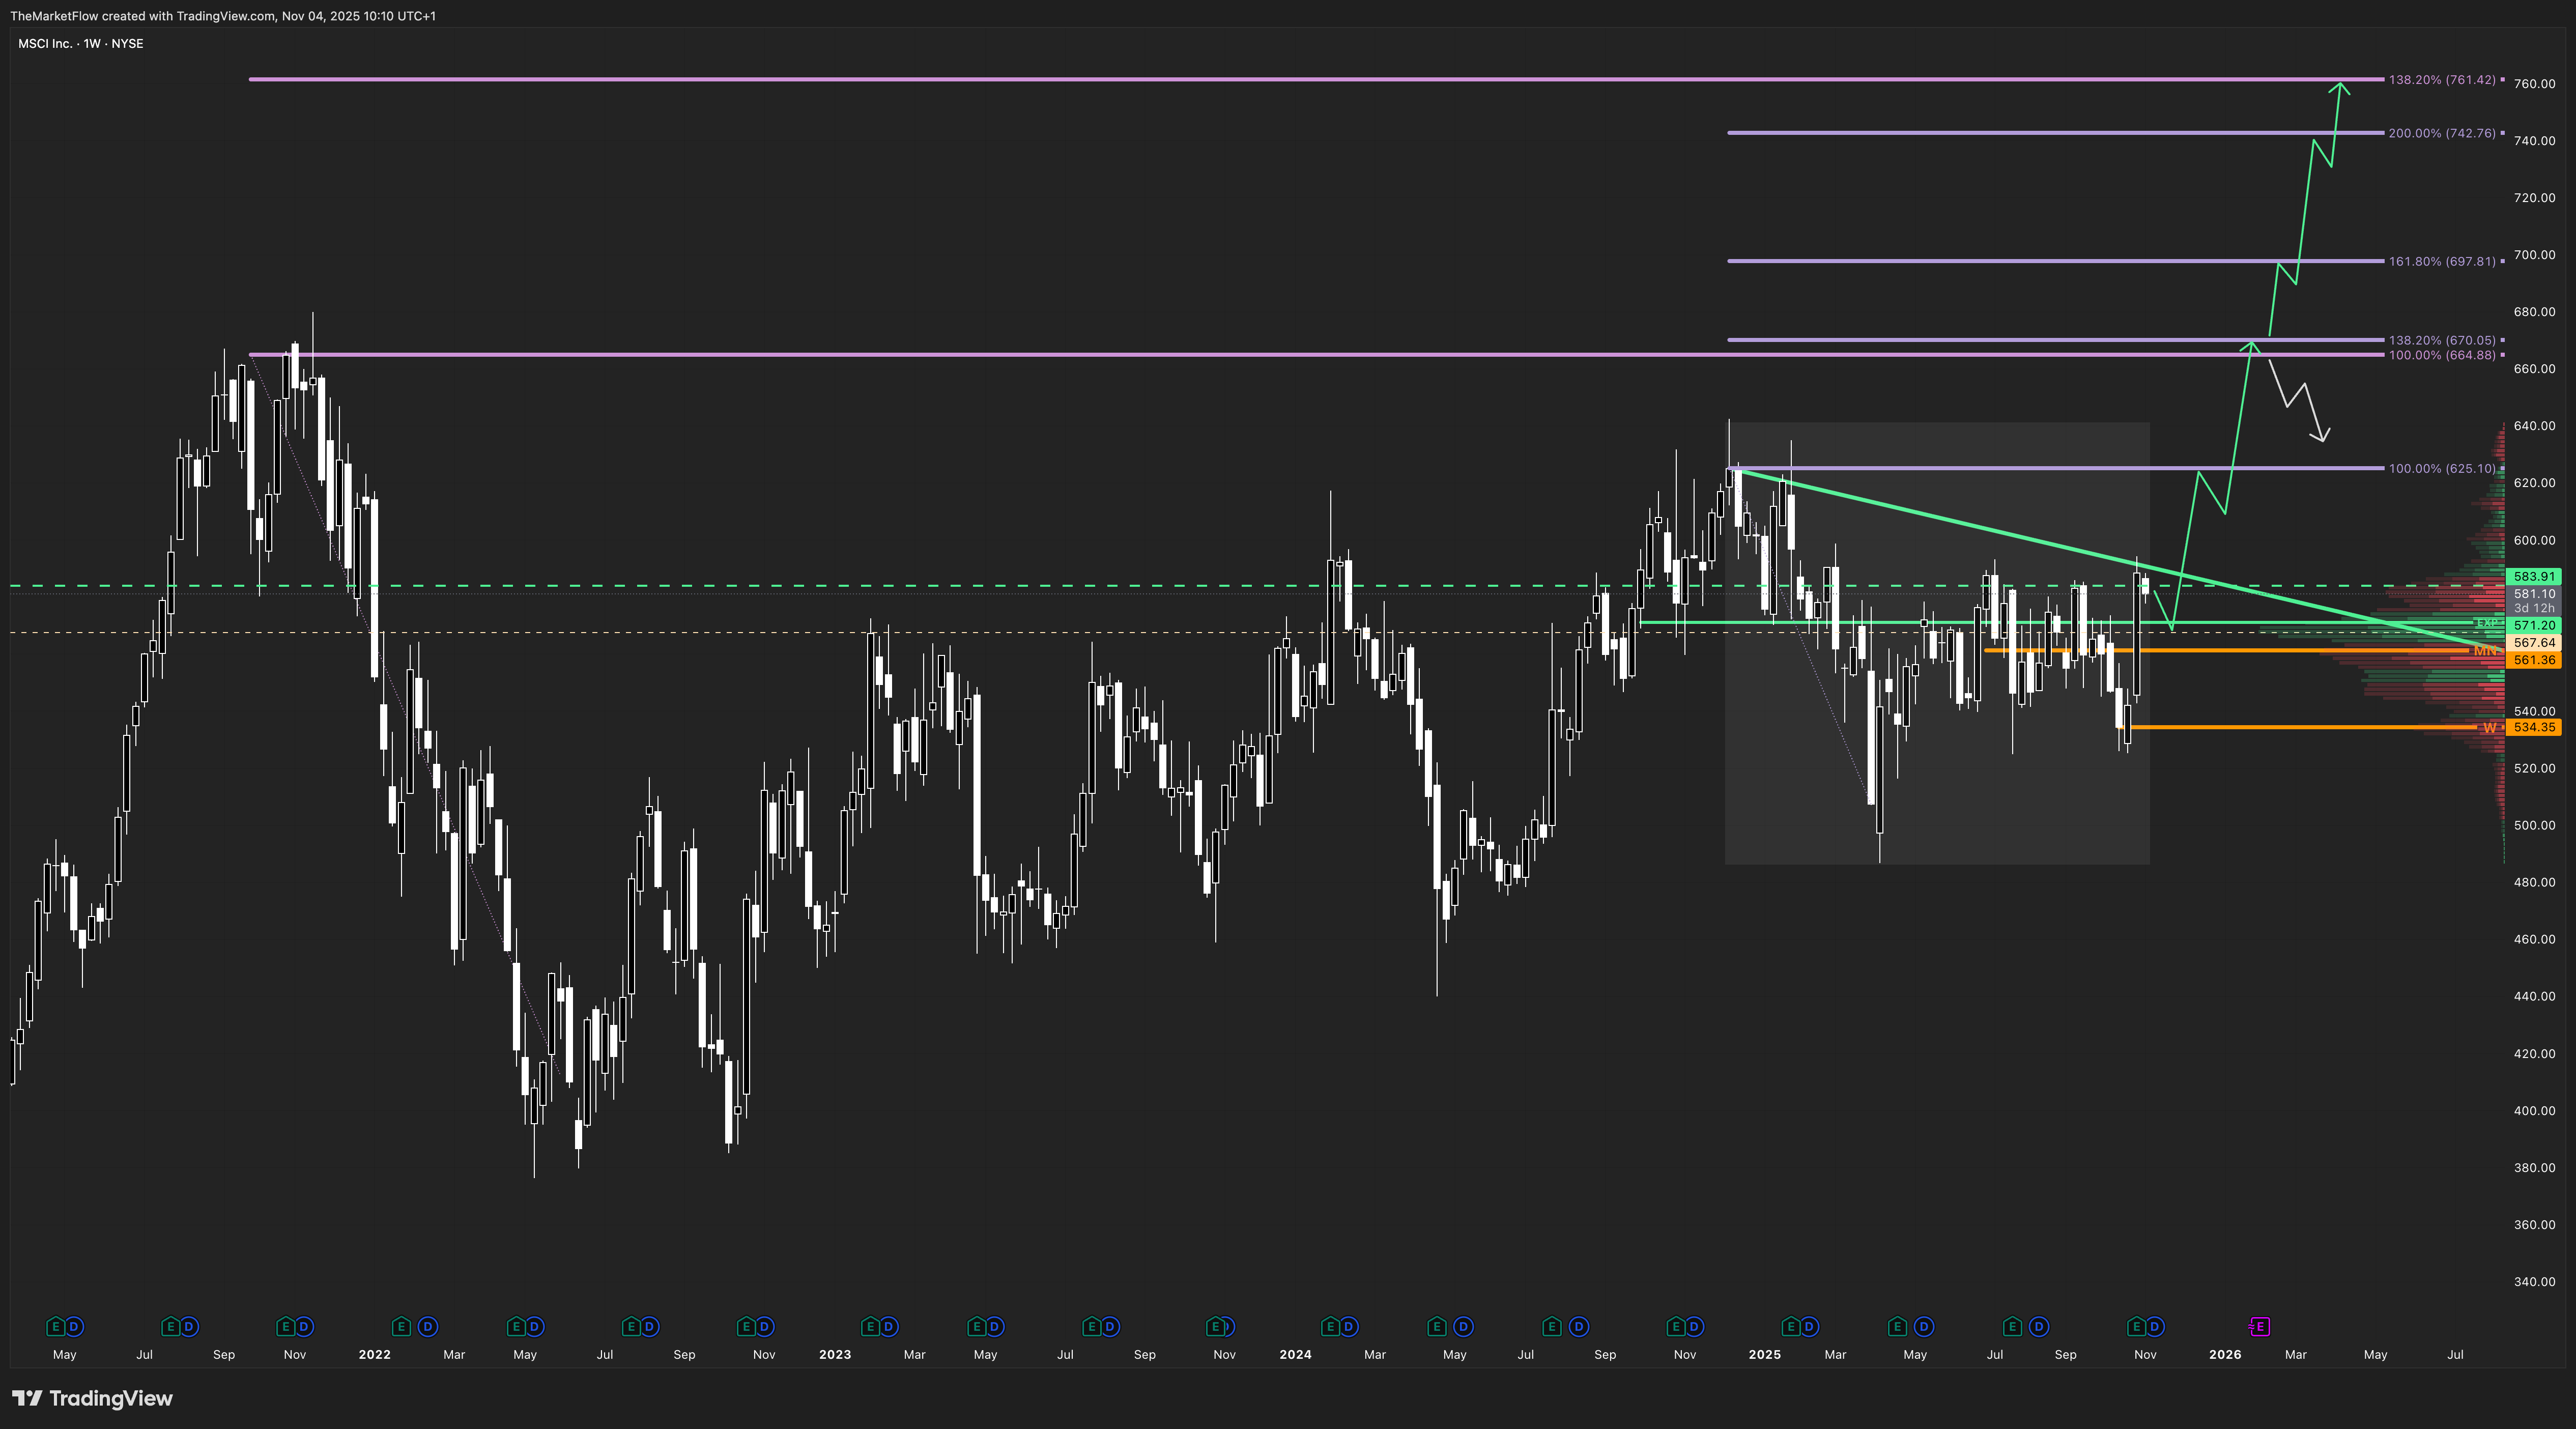
The weekly timeframe has completed a full upward impulse that broke the prior swing high in a single leg, suggesting near-term exhaustion. A corrective phase is likely, with retracement potential toward the daily correction Fibonacci zone and the breakout range 569.11–553.58. Despite this expected correction, structural context remains bullish as the countertrend break on the monthly has already confirmed. The 534.35 weekly pivot remains the secondary invalidation level.
Daily
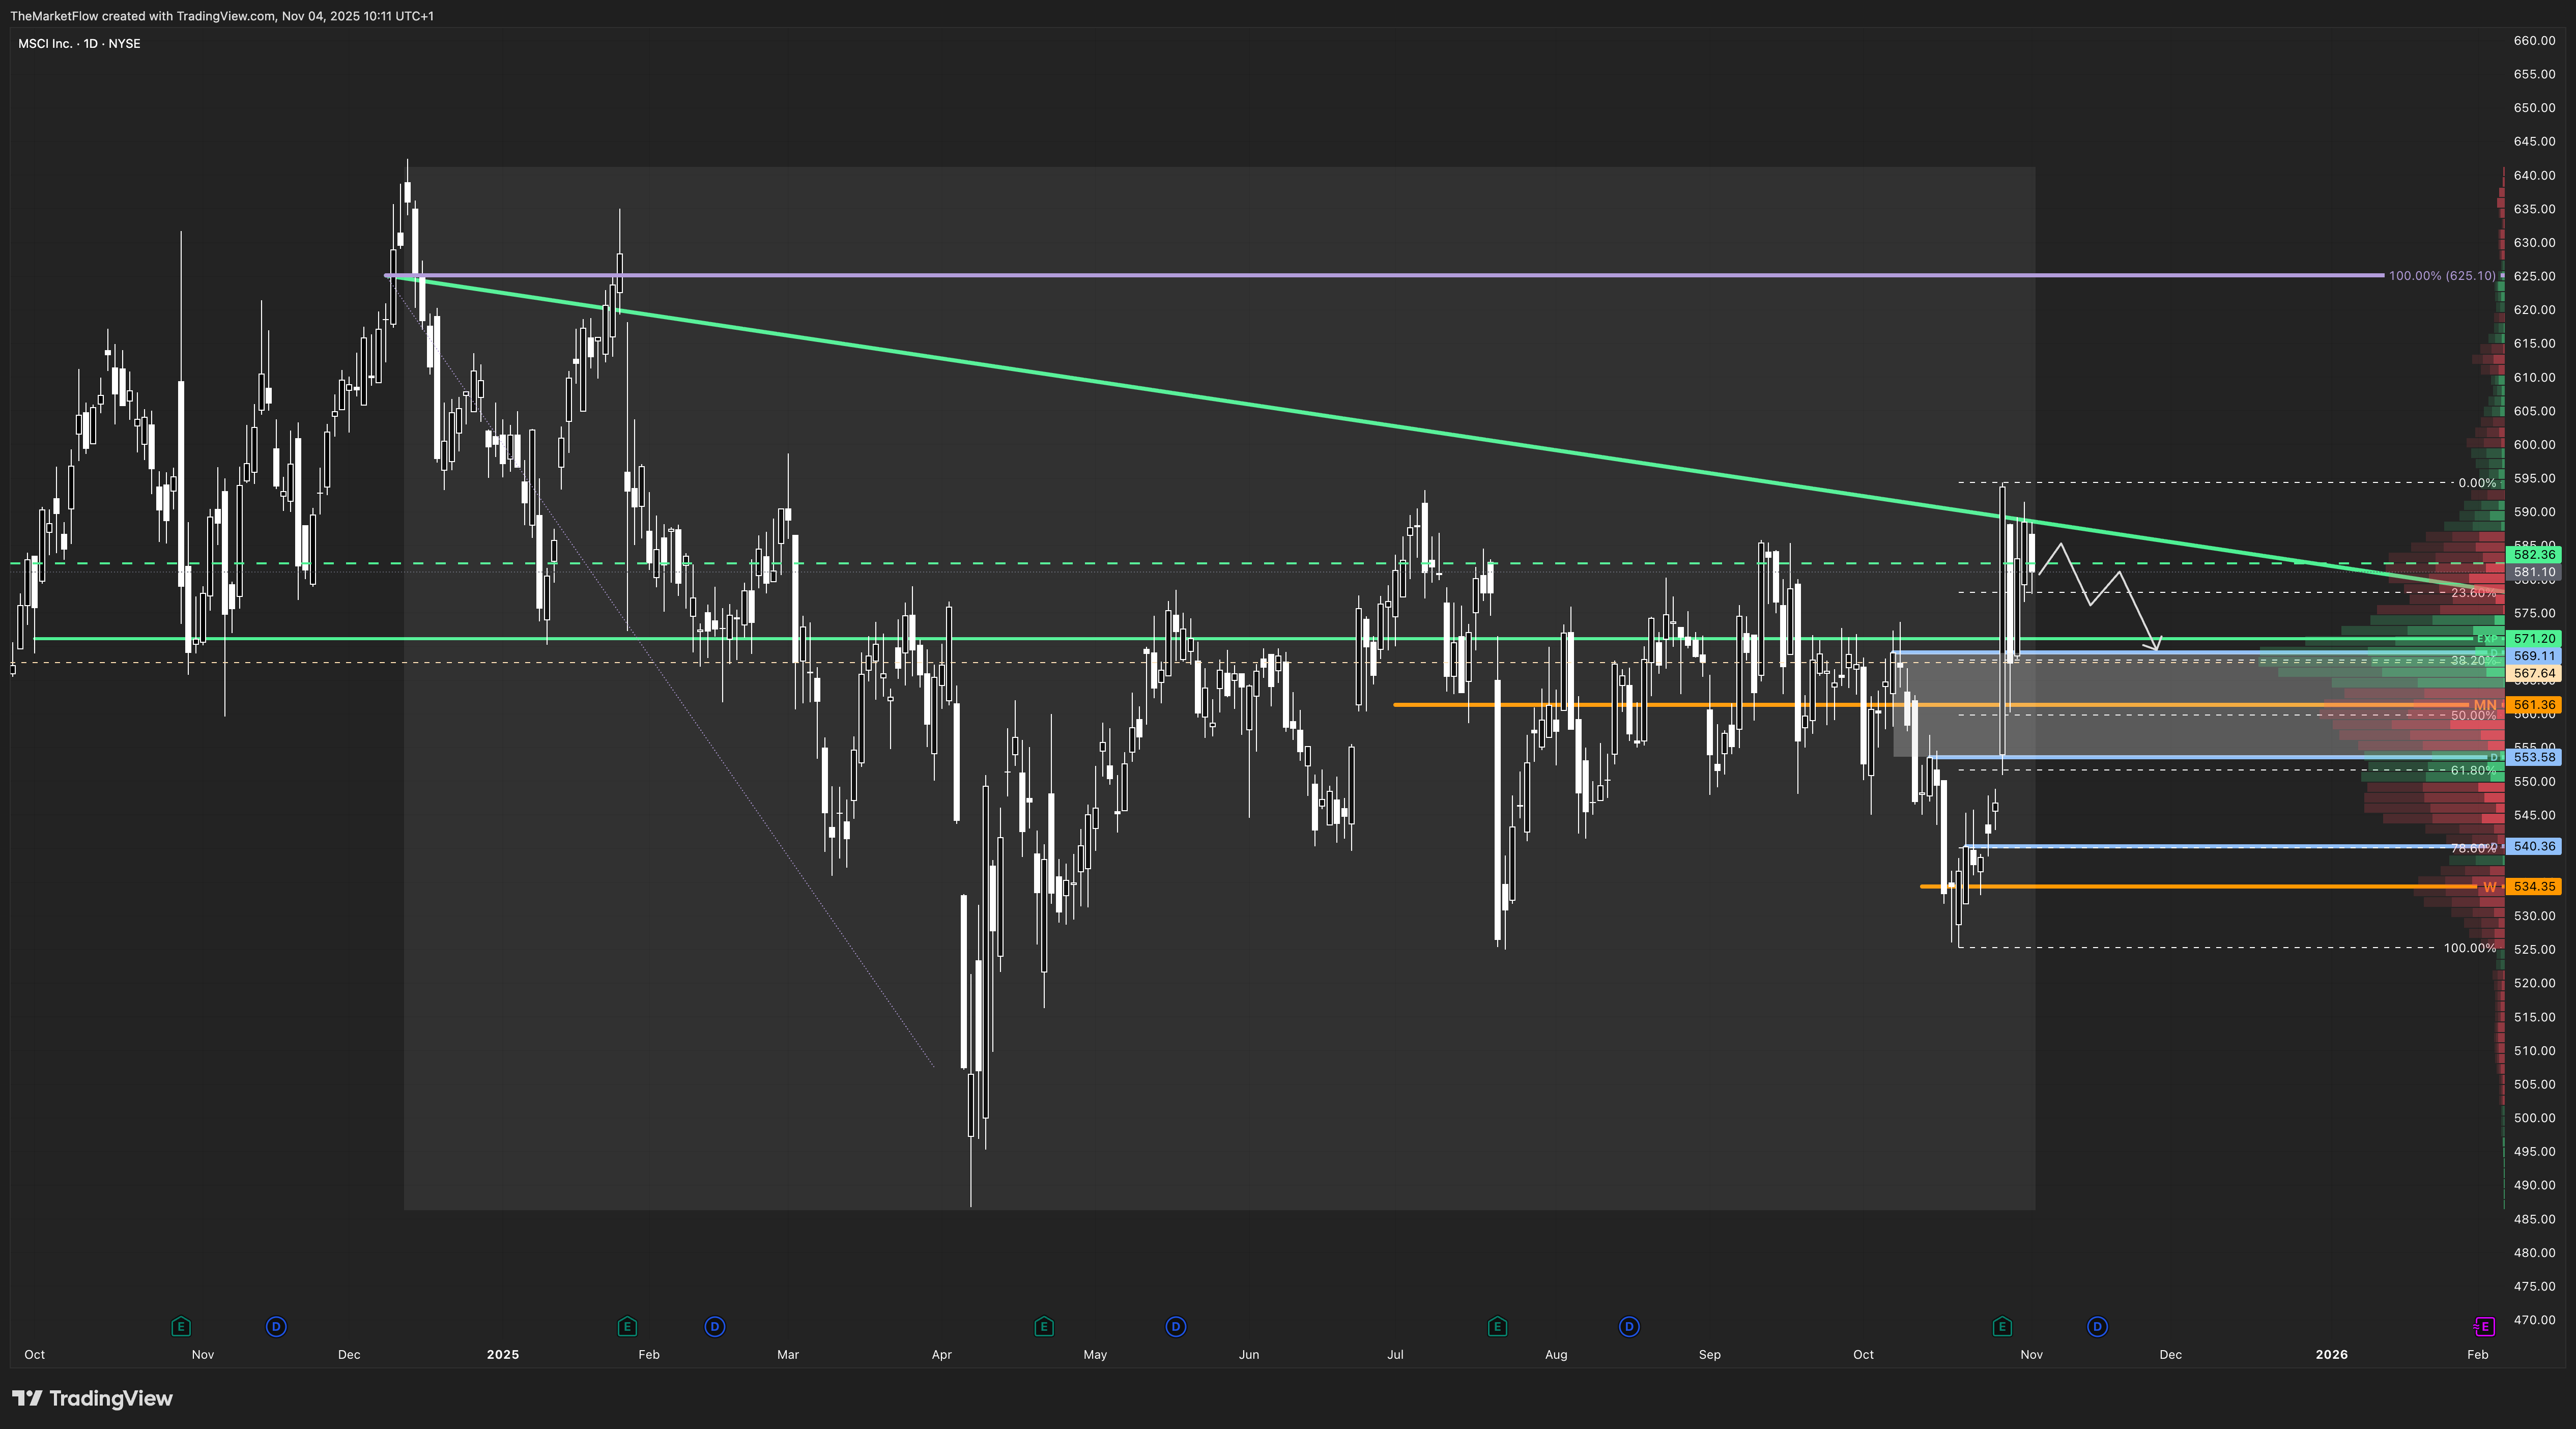
Price is forming a corrective structure beneath the trendline retest, with overlapping waves suggesting the start of consolidation. The correction zone spans the 569–553 area — aligning with the 38.2–61.8% retracement of the recent weekly impulse. Maintaining higher lows above 561.36 would reinforce structural accumulation ahead of potential continuation toward the expansion targets.
Trade Structure & Levels
Bias: Long above weekly pivot 534.35
Phase: Expansion (monthly) / Start of Correction (weekly–daily)
Trigger: Monthly close above countertrend + 583.91 VAH (confirmed)
Invalidation: Monthly close below 561.36 or Weekly close below 534.35
Path → Correction toward 566–553, continuation potential toward 664–670, extended target 761.42
Risk & Event Context
MSCI’s next earnings release is scheduled within Q1 2026. Broader equity sentiment remains sensitive to U.S. rate expectations and global ETF inflows, both key to MSCI’s index and analytics business demand. Volatility pockets may emerge around macro data affecting institutional allocation trends.
Conclusion
The multi-timeframe structure confirms a completed countertrend break and active expansion phase on the monthly horizon. A corrective retracement is likely in the near term, but as long as the 561.36 pivot remains intact, the bullish expansion path toward 664–761 remains structurally valid.
Disclaimer
This publication is provided for informational and educational purposes only and does not constitute investment advice, a solicitation, or a recommendation to buy or sell any security, derivative, or financial instrument. The analysis and opinions expressed reflect the author’s views at the time of writing and are subject to change without notice.
All information is derived from publicly available sources believed to be reliable, but accuracy and completeness are not guaranteed. Past performance is not indicative of future results, and no representation or warranty is made regarding future price behavior or outcomes.
Readers are solely responsible for their own investment decisions and should consult a qualified financial advisor before acting on any information contained herein.
The author and/or affiliates may hold, trade, or have a financial interest in the securities or instruments mentioned in this publication. Neither the author nor any associated party accepts liability for any direct or consequential loss arising from the use of this material.