
GOLD: Trend Intact, Countertrend in Play
Multi-timeframe technical analysis reveals where trend alignment could drive the next breakout

Gold continues to trade within a powerful long-term uptrend, with structural alignment across all major timeframes. While the broader trend remains bullish, current price action suggests a short-term decision point developing, which may present an opportunity for trend-continuation entries.
Monthly Timeframe – Exponential Bull Trend with Resistance Reaction
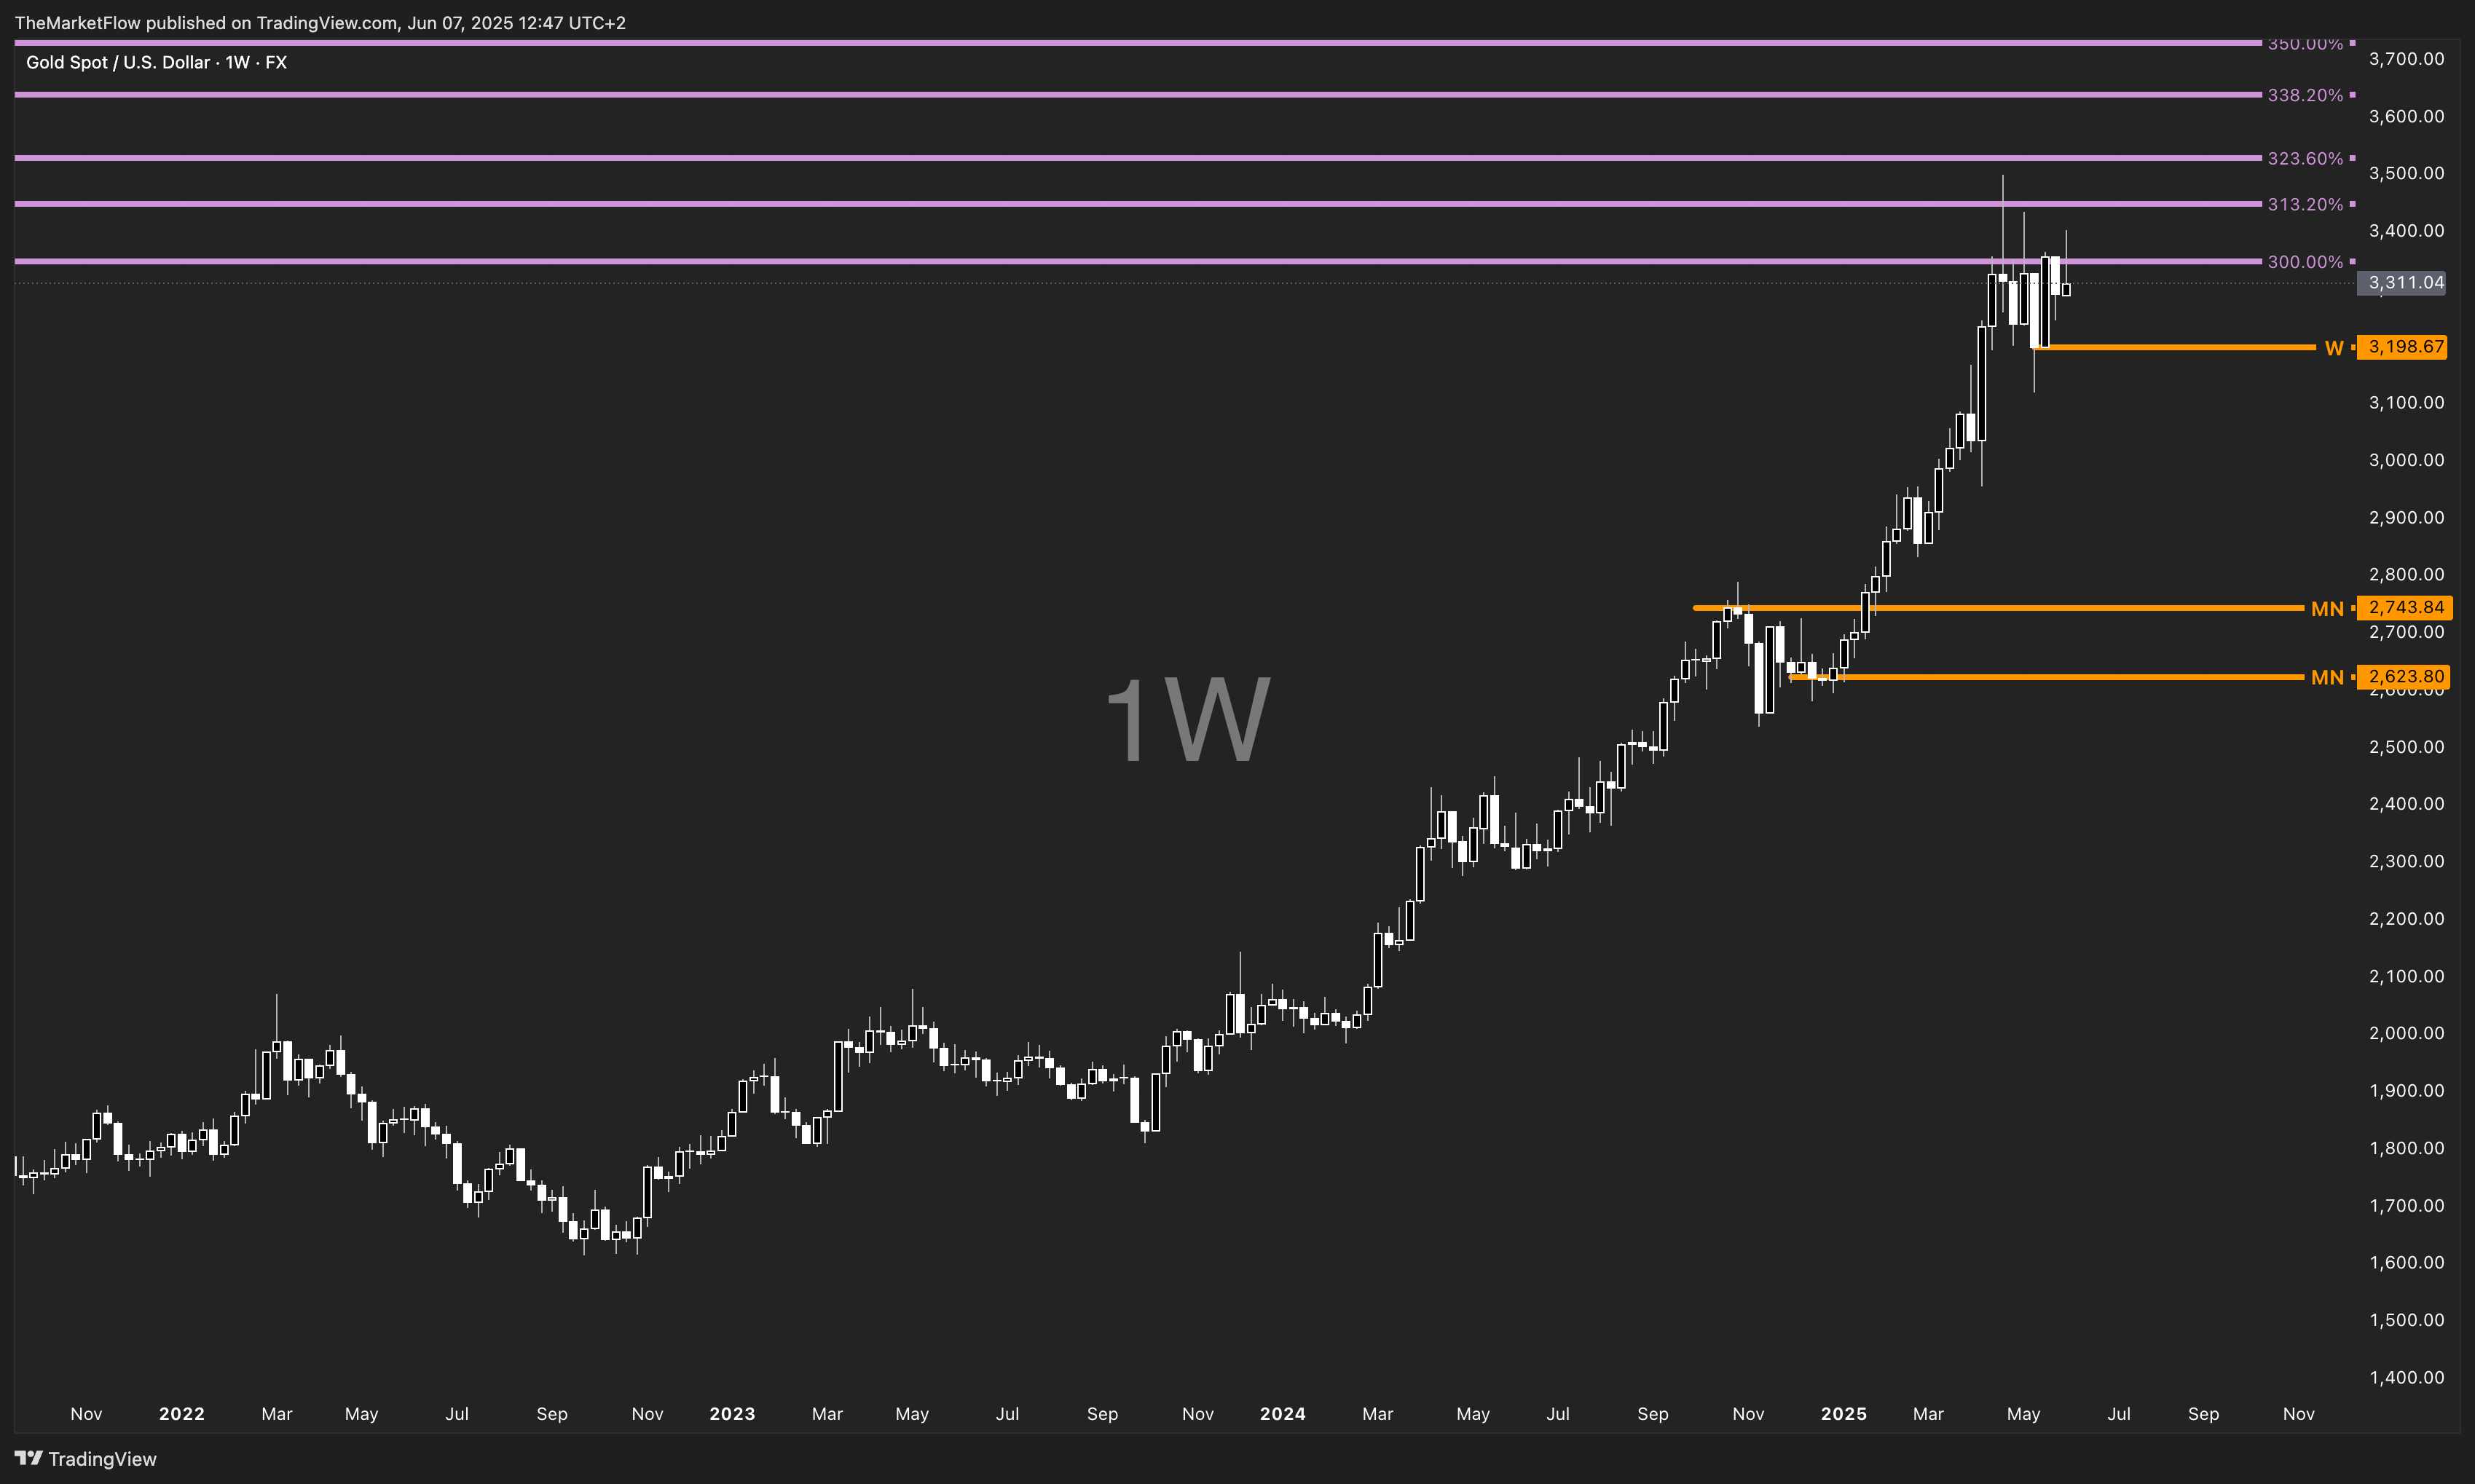
On the monthly chart, Gold is clearly in an exponential long trend structure, marked by steep price acceleration and consistent higher highs. The previous two monthly candles have printed upper shadows precisely at the 300% Fibonacci extension level, indicating a potential short-term exhaustion or profit-taking phase at this historically significant level.

However, this is not a reversal signal in itself—just a sign of deceleration within the context of a strong trend. The bullish macro structure remains intact, supported by a parabolic trendline and a clean wave sequence from previous consolidation zones.
Weekly Timeframe – Trend Intact Above the Pivot
Zooming into the weekly timeframe, the price is consolidating just below the monthly Fibonacci target, yet holding above the key weekly pivot at 3,198.67, which serves as the structural anchor of the trend. As long as this level holds, the impulse remains valid.
There is no sign of a breakdown, only a pause. Fibonacci extension targets from the weekly wave structure suggest the medium-term targets extend well above 3,500 if the consolidation resolves to the upside.
Daily Timeframe – In Sync with Higher Timeframes, but Facing Short-Term Correction
The daily chart shows that the market is already in a confirmed long trend, after breaking the countertrend, therefore, aligned with the higher timeframes. However, a short-term descending channel has developed, suggesting a valid countertrend within the larger trend.

Key support lies at the daily pivot zone (orange, around 3,286–3,317), which remains the structural boundary for the continuation idea. The price has tested this zone and reacted, and if the descending structure breaks upwards, it could open the path toward the daily peak at 3,435, and higher.
4H Timeframe – Tactical Entry Zone Developing
On the H4 chart, we see a clear short-term countertrend structure still in play. The market has pulled back into a key trendline support zone while respecting the wave structure of the H4 correction.
If the market prints higher lows and bullish wave formations at the green trigger zone, that would synchronize all timeframes (Monthly–Weekly–Daily–H4) in a unified long direction. In that case, the daily peak and the 3,400–3,435 Fibonacci zone, and even the daily Fibonacci targets beyond, become valid targets for the coming week.

This green zone is not a forecast—rather, it’s a trigger area where the probabilities shift in favor of the trend continuation.
Conclusion
I don’t forecast—I analyze without bias. My method is to assess the trend structure across multiple timeframes and define potential trigger levels where all timeframes align. When this alignment occurs, markets often transition into expansion phases—those fast, directional moves that trend-following traders seek.
In Gold’s current setup, the trend is clearly long, but the market is in a short-term correction. A return of bullish structure on the H4 around the current zone could present a high-probability continuation opportunity in sync with the dominant macro trend.
Stay focused on structure, alignment, and validation—not prediction.
This analysis is not a forecast. It reflects the structure of the market and the zones where trend alignment across timeframes may trigger expansion phases.