
GILD | Monthly Breakout — Expansion Setup in Formation
Multi-timeframe bullish alignment with daily countertrend nearing trigger confirmation — expansion path forming toward upper Fibonacci objectives.

The Market Flow | November 2, 2025
Company Overview
Gilead Sciences, Inc. develops and markets antiviral therapeutics, focusing on HIV, hepatitis, and emerging infectious diseases. Its revenue base is driven primarily by recurring pharmaceutical sales and licensing income, with consistent cash generation supporting research investment and shareholder returns. The company maintains a mature product portfolio with selective expansion into oncology and immunology through strategic acquisitions.
Gilead represents a stalwart business type — a large, stable pharmaceutical firm with established cash flows and moderate, innovation-driven growth potential.
Technical Overview
Monthly
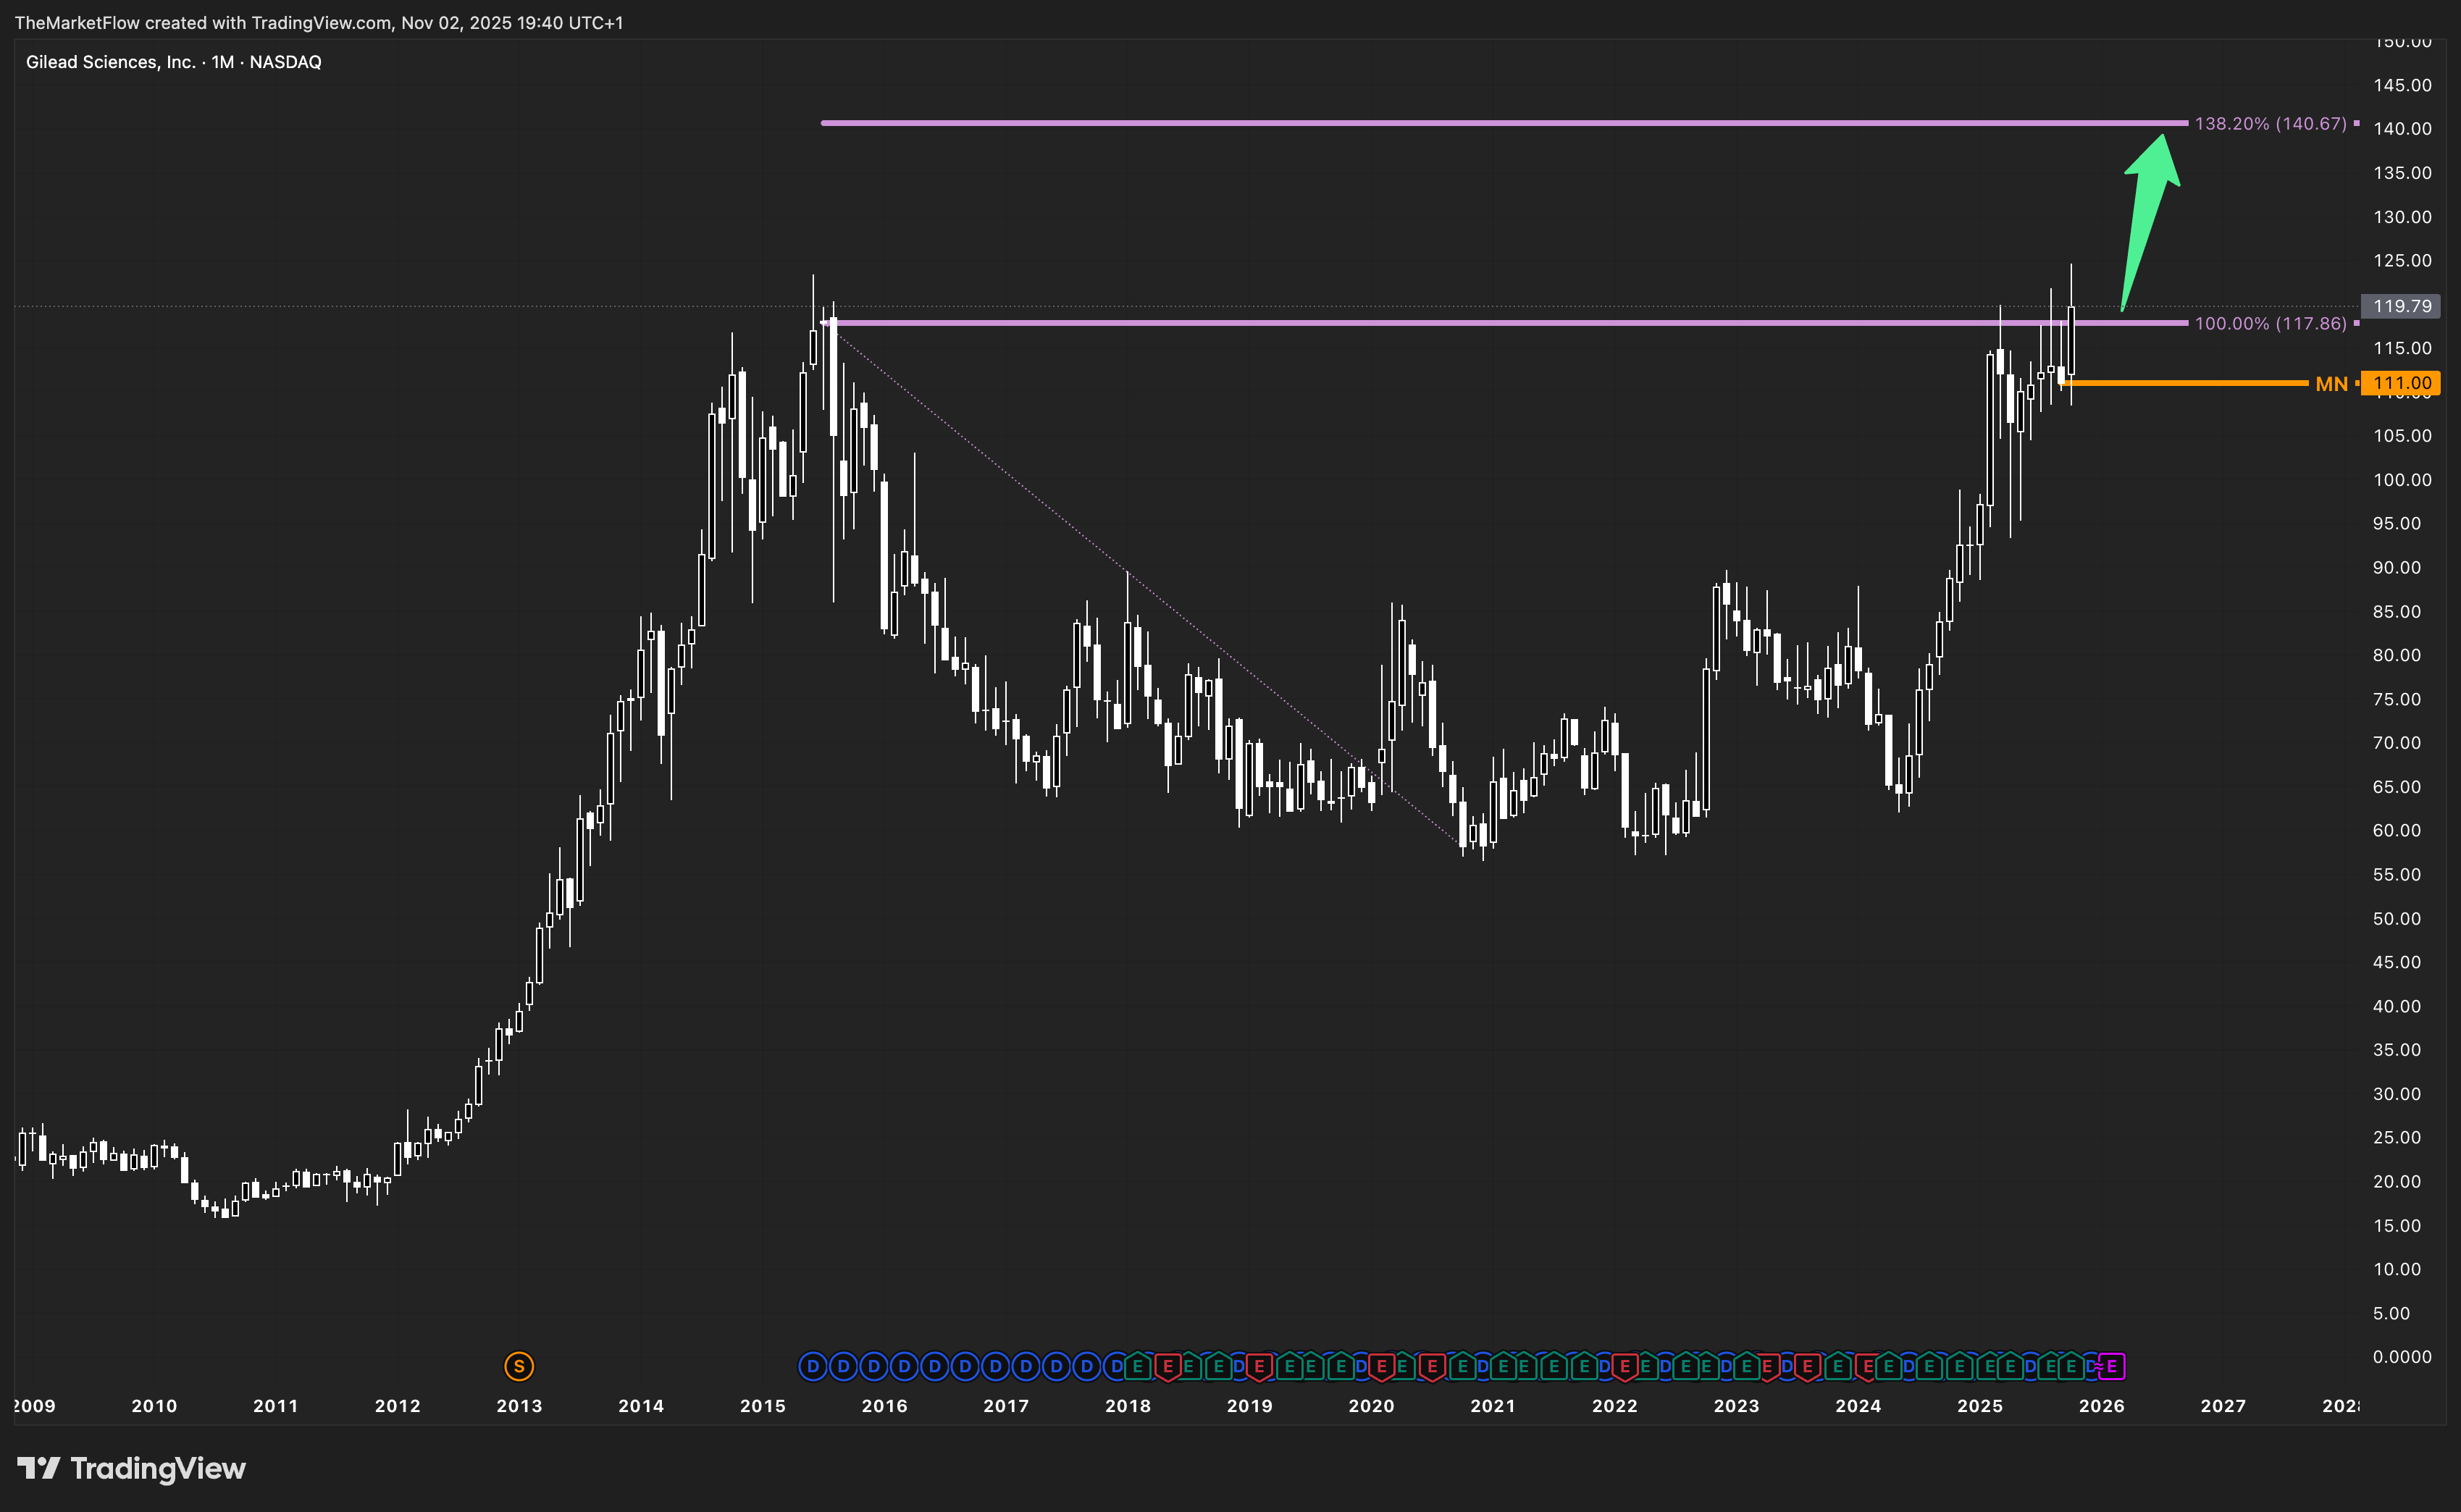
Price has confirmed a structural breakout above the prior major high, completing the 100% Fibonacci extension at 117.86. The breakout reaffirms long-term bullish alignment, marking the transition into an Expansion phase with the next structural objective at the 138.2% level (140.67). As long as the monthly structure remains supported above the 111.00 pivot, momentum bias stays long, and any retracement would likely serve as continuation.
Weekly
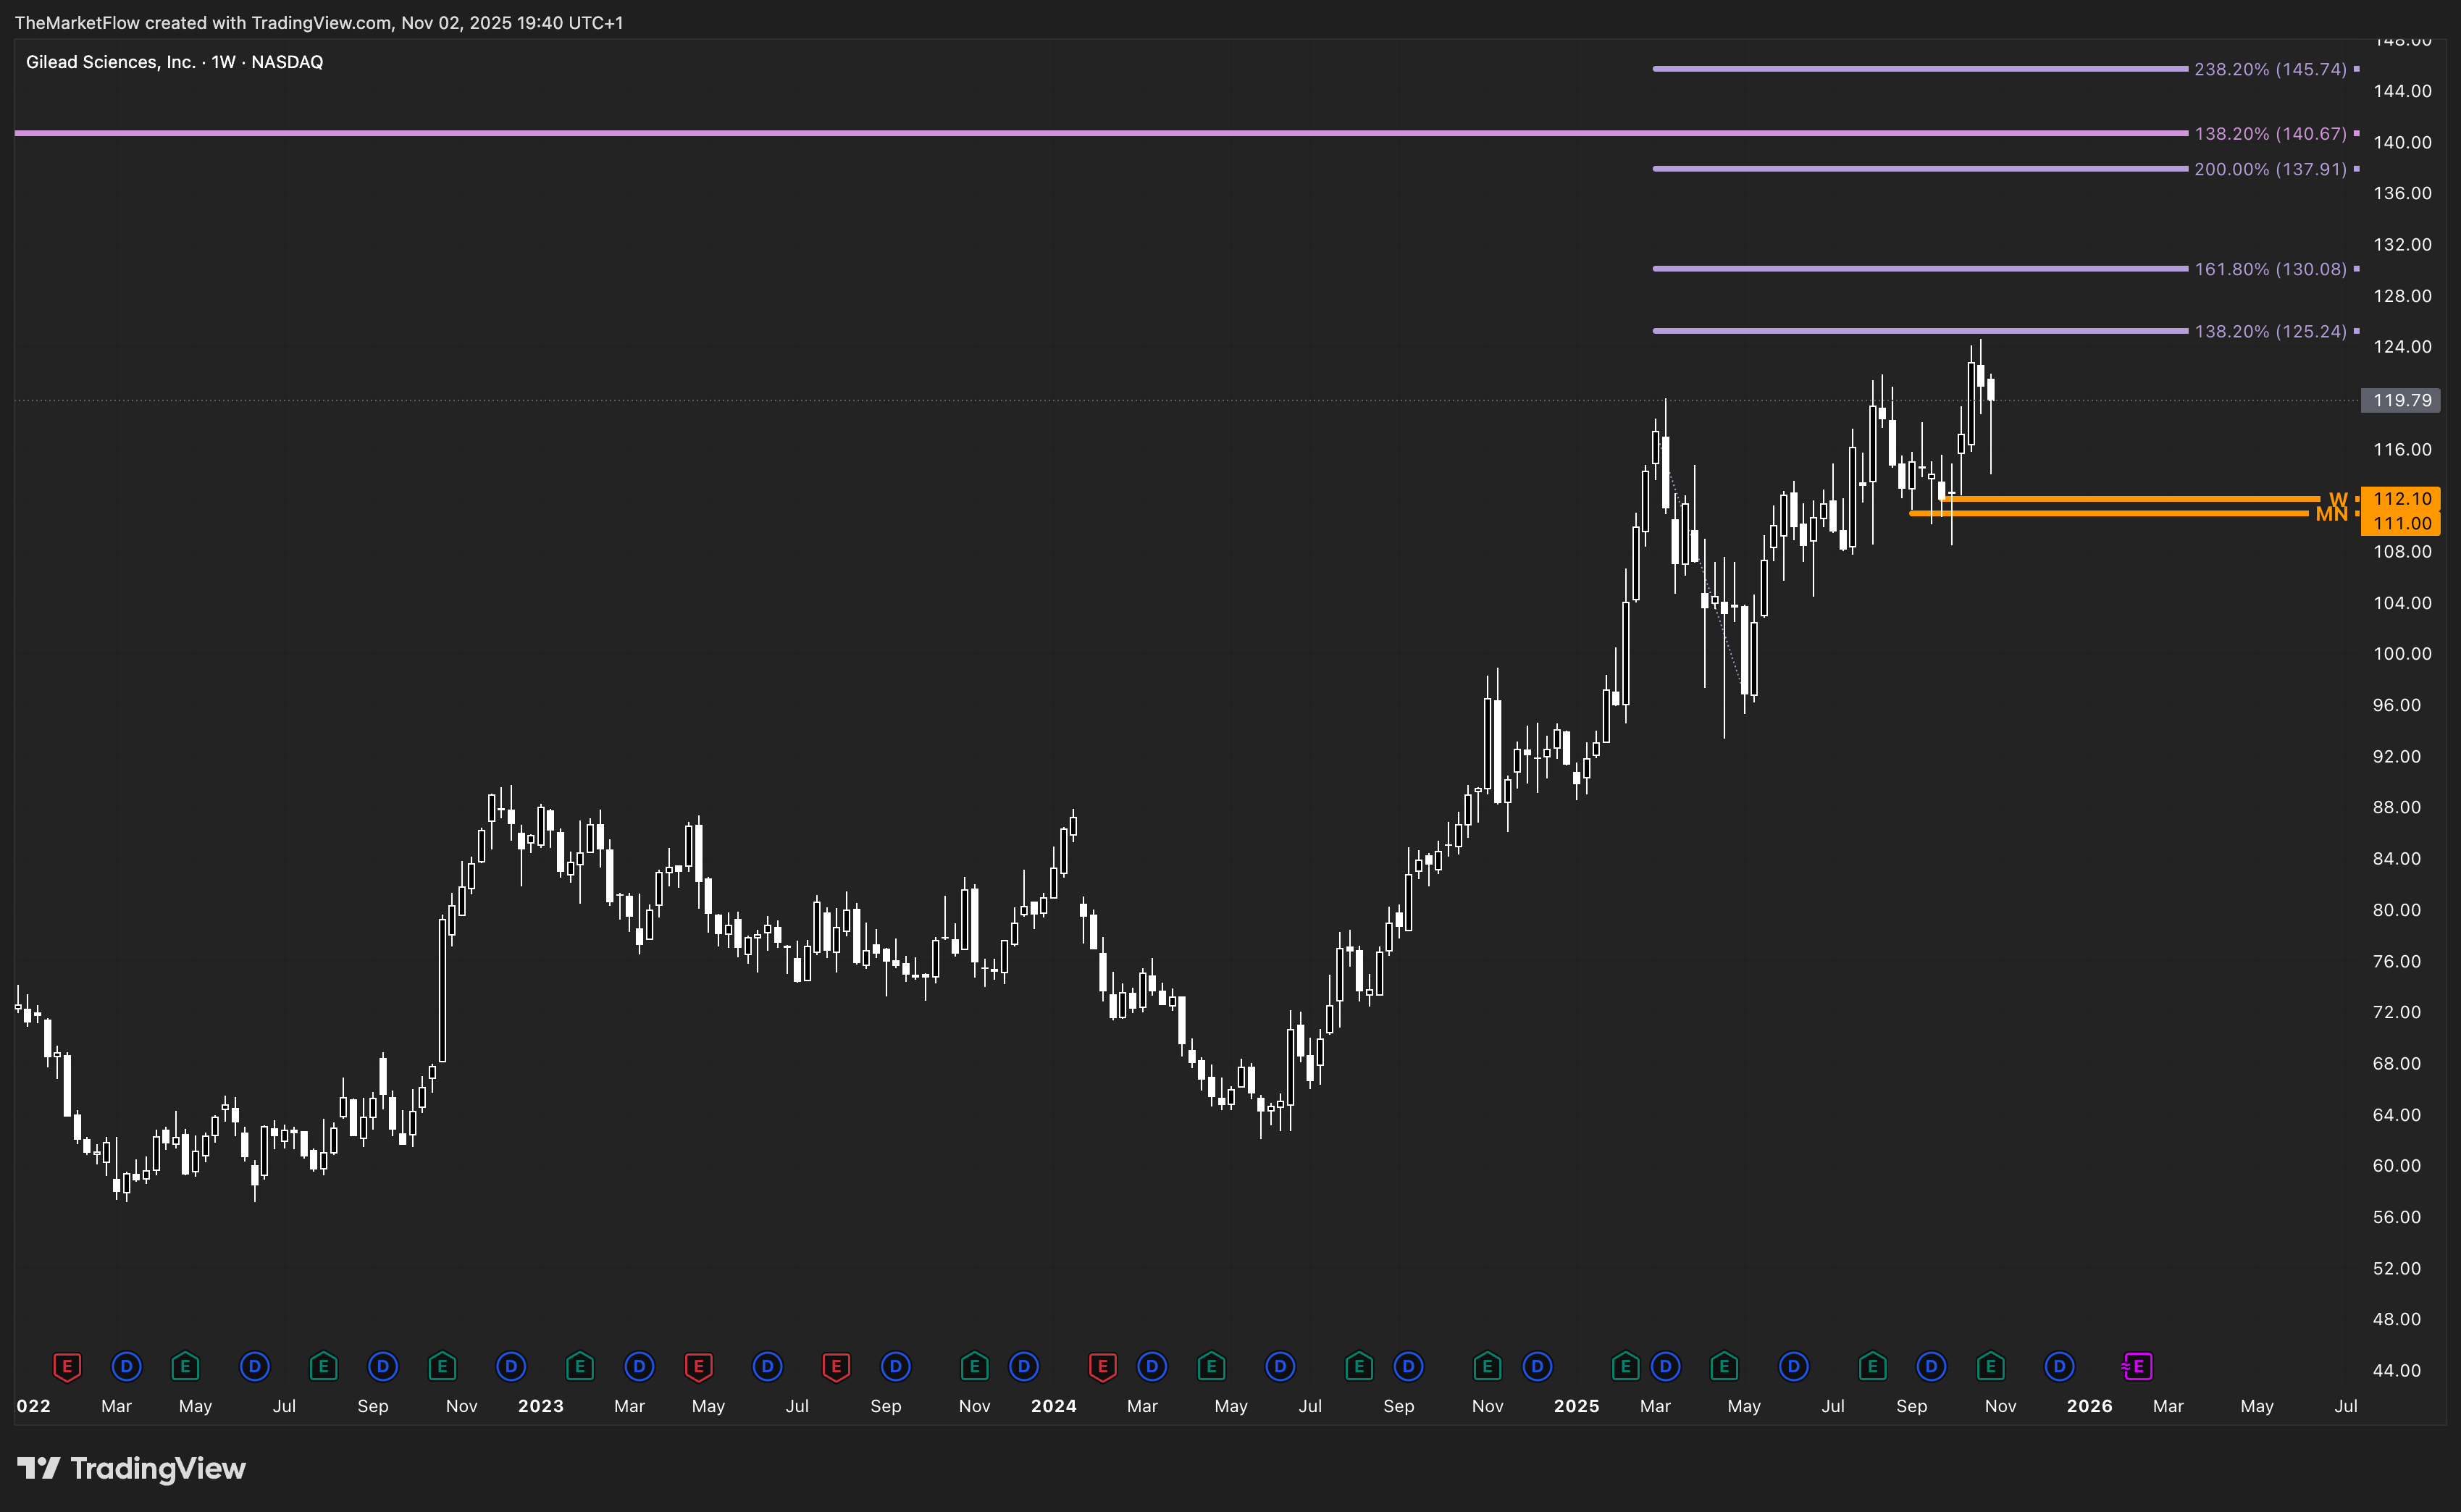
The weekly trend remains firmly bullish, supported by a sequence of higher highs and higher lows. Structure shows compression just above the 112.10–111.00 pivot zone, maintaining support integrity while price consolidates below the Fibonacci cluster between 125.24–130.08.
This forms a valid accumulation band within the broader expansion context, awaiting daily confirmation to resume trend continuation toward 140.67.
Daily
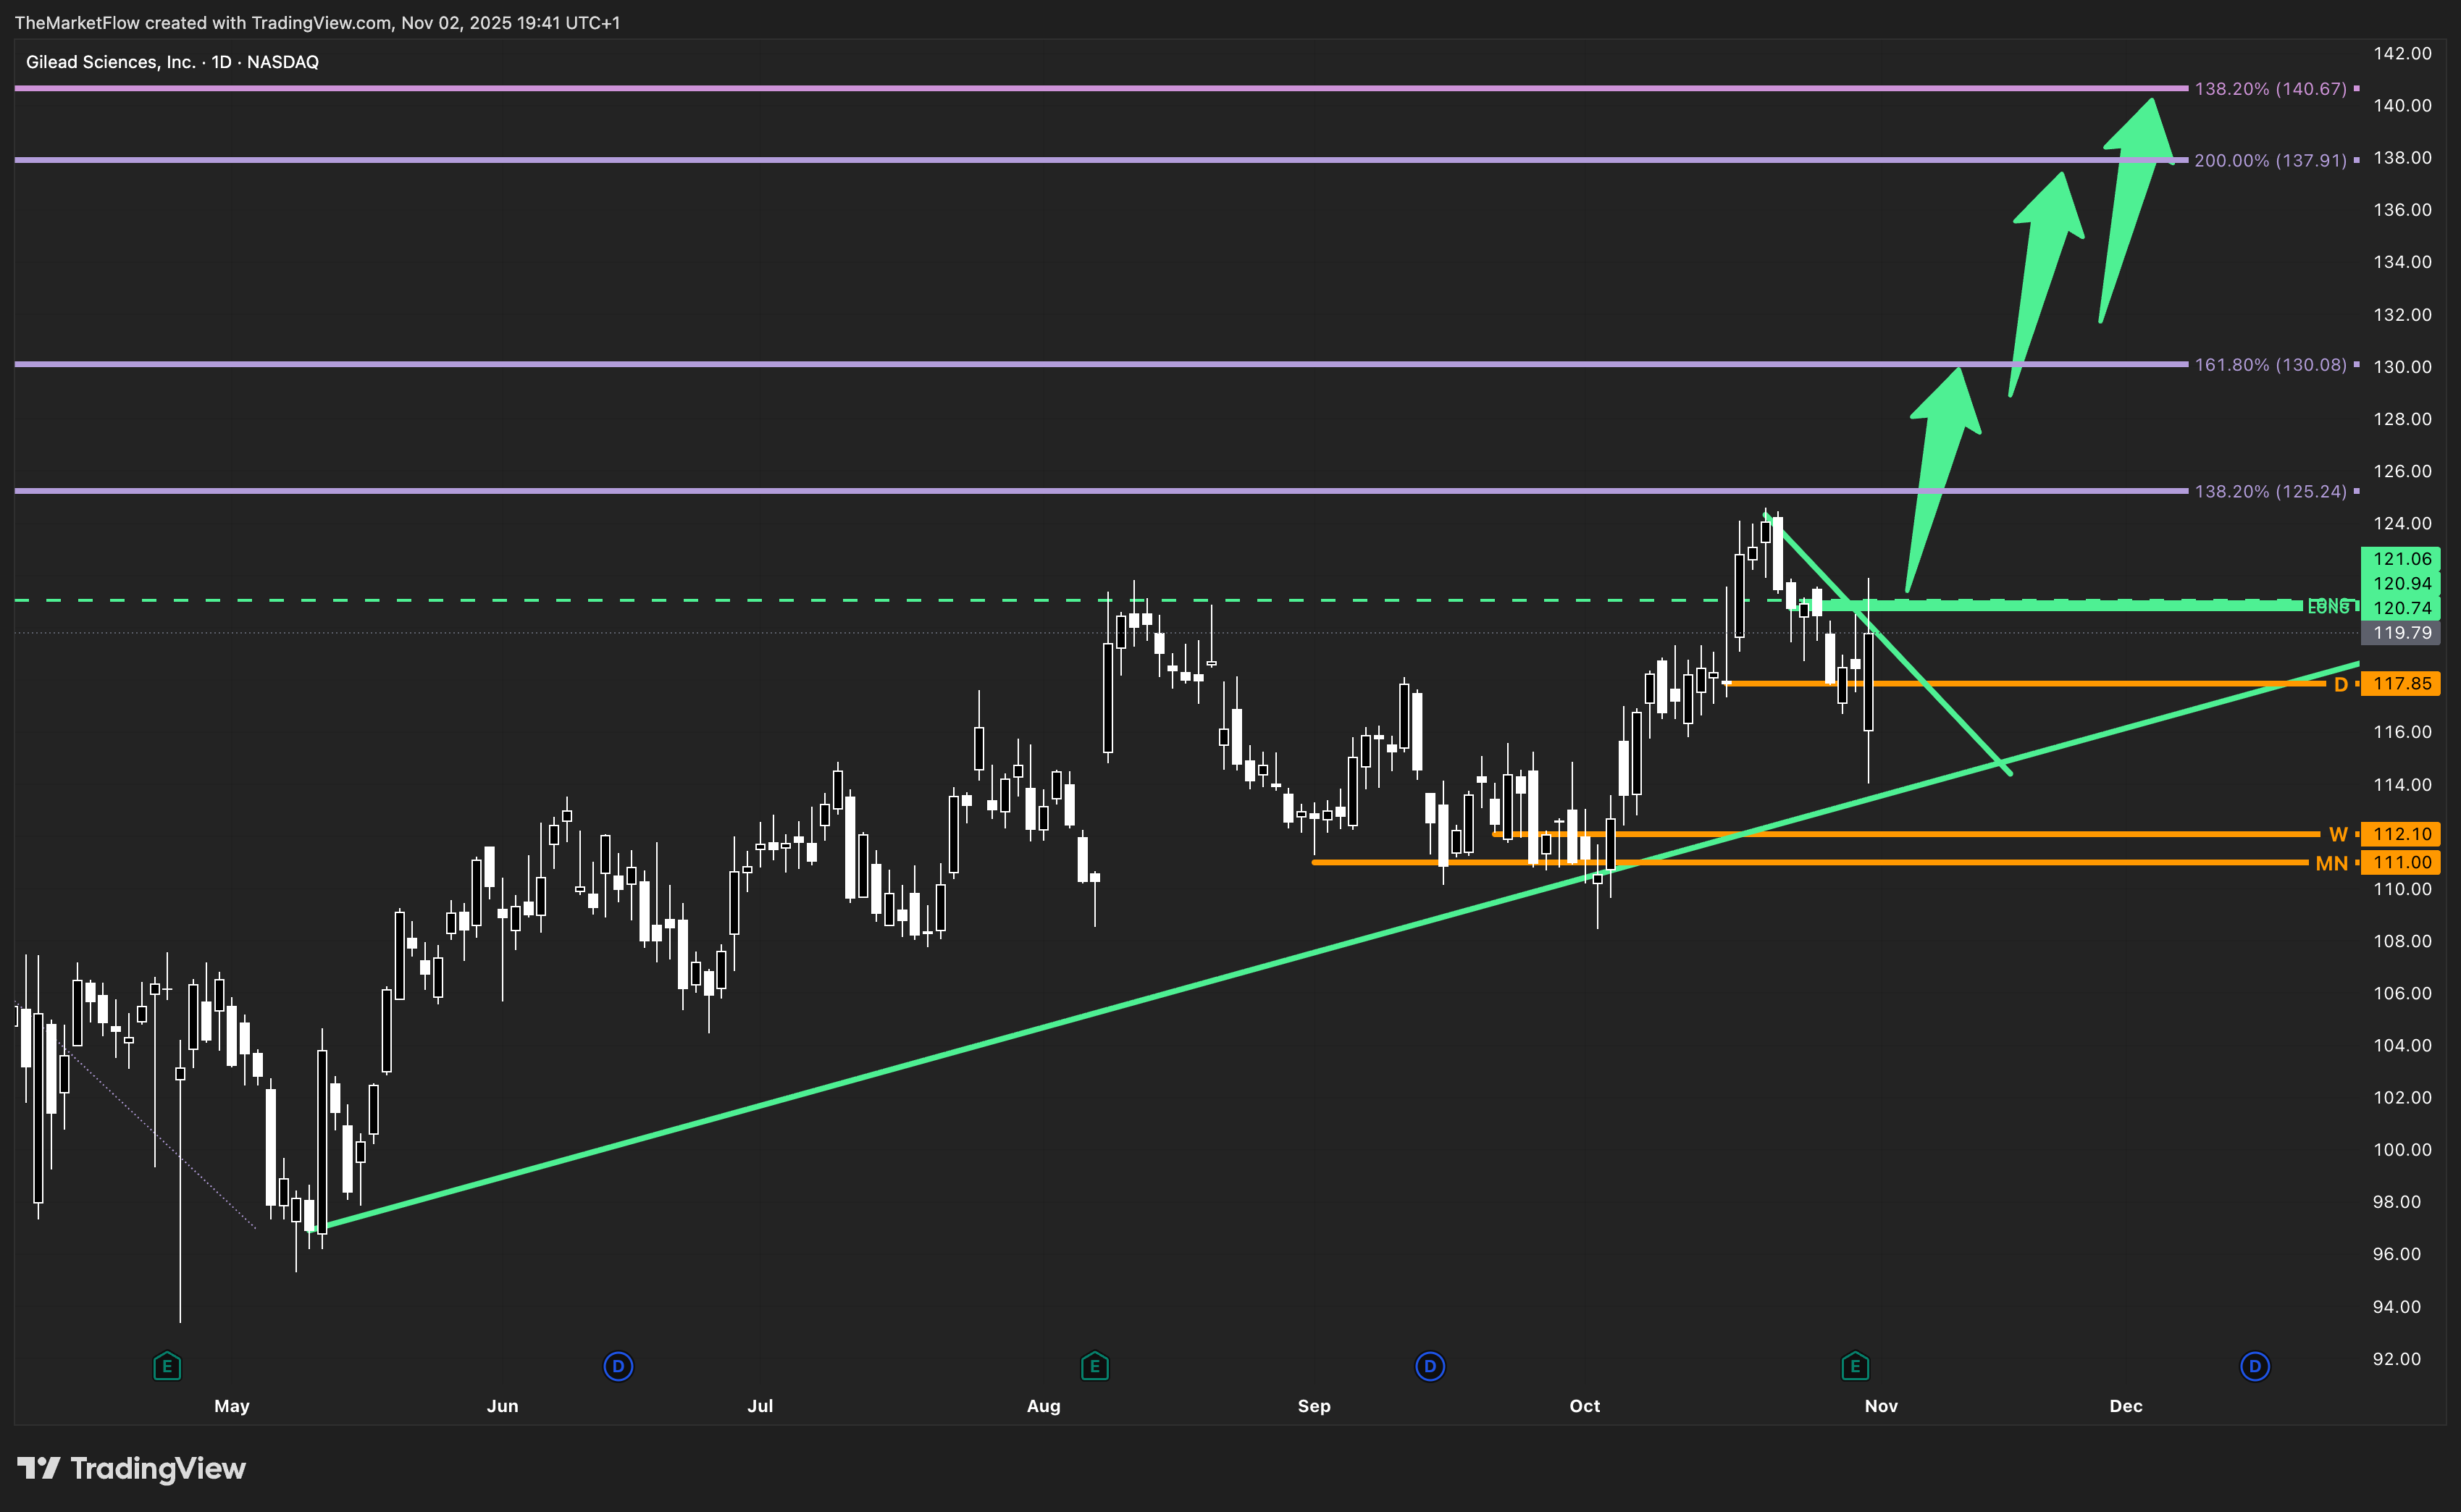
The daily chart displays a countertrend structure following the recent impulse, with price still trading above the 117.85 daily pivot — preserving the bullish framework. The green dashed line (Value Area High) and the dual “LONG” triggers (120.74 / 120.94 / 121.06) define the confirmation zone. A full candle close above this zone would activate the next wave of expansion toward 125.24, 130.08, and 137.91.
H4
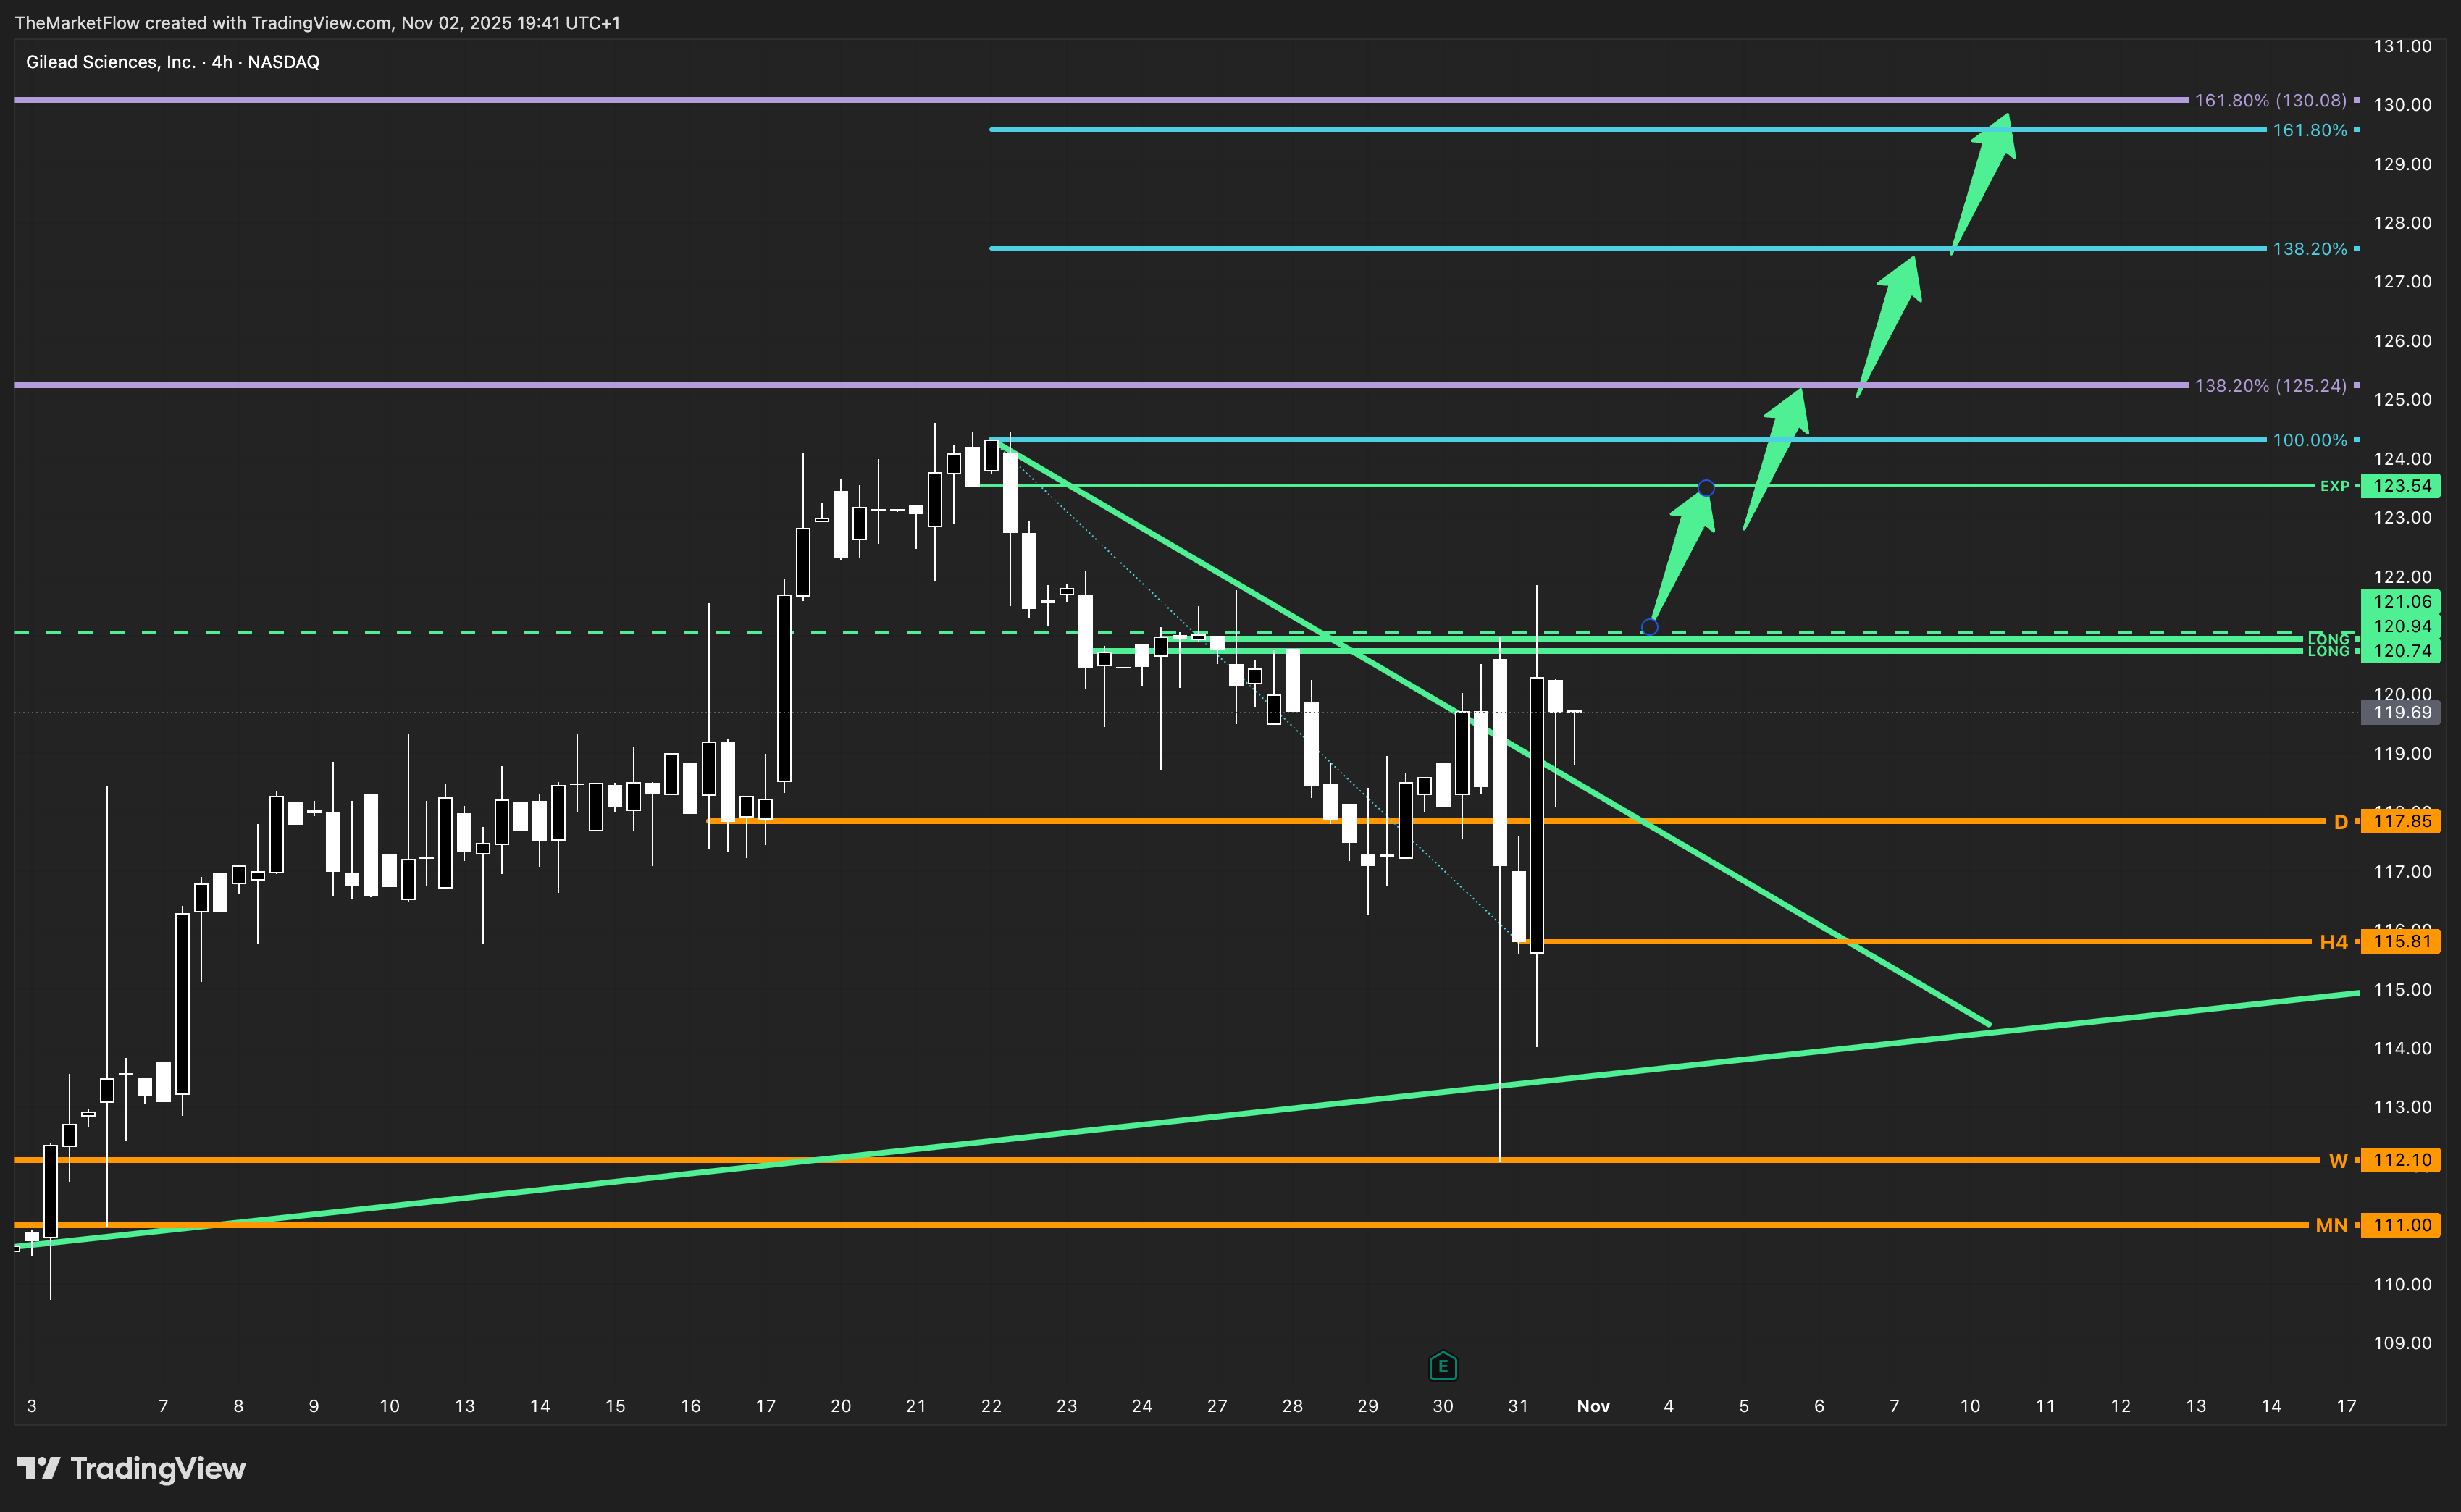
The intraday view highlights a descending countertrend line intersecting the upper trigger zone near 121.00. A confirmed H4 close above this area would validate the countertrend break and transition the short-term structure into expansion alignment. The successive expansion path projects upward through 123.54 → 125.24 → 130.08, while the active pivot at 115.81 defines immediate invalidation.
Trade Structure & Levels
Bias: Long above Weekly pivot 112.10
Phase: Countertrend Break → Expansion setup
Trigger: Daily close above 121.06
Invalidation: H4 close below 115.81
Path → 123.54 → 125.24 → 130.08 → 140.67
Risk & Event Context
Earnings season adds volatility risk as Gilead’s upcoming quarter may update guidance for oncology and antiviral segments. Broader healthcare sector rotation and rate-sensitive flows could affect short-term momentum. Macro drivers remain secondary; structure remains technically driven by the breakout setup.
Conclusion
Multi-timeframe alignment supports a bullish continuation scenario. Monthly and weekly expansions are intact, with the daily countertrend forming the final setup layer. A confirmed close above 121.06 would shift the structure into active expansion toward higher Fibonacci extensions.
Disclaimer
This publication is provided for informational and educational purposes only and does not constitute investment advice, a solicitation, or a recommendation to buy or sell any security, derivative, or financial instrument. The analysis and opinions expressed reflect the author’s views at the time of writing and are subject to change without notice.
All information is derived from publicly available sources believed to be reliable, but accuracy and completeness are not guaranteed. Past performance is not indicative of future results, and no representation or warranty is made regarding future price behavior or outcomes.
Readers are solely responsible for their own investment decisions and should consult a qualified financial advisor before acting on any information contained herein.
The author and/or affiliates may hold, trade, or have a financial interest in the securities or instruments mentioned in this publication. Neither the author nor any associated party accepts liability for any direct or consequential loss arising from the use of this material.