From Liquidity Grab to Launchpad? Bitcoin Tests a Pivot Zone
Bears failed to hold the breakdown—can bulls flip the reaction zone and unlock the next leg toward $118K and beyond?
Bitcoin Technical Analysis – Weekly to H4
June 7, 2025
Weekly Structure – First Target Reached, Market Reacts
On the weekly timeframe, Bitcoin has delivered a clean impulsive move, breaking through the macro resistance trendline and reaching the 123.6% Fibonacci extension. This target, aligned with historical market reactions, served as a major resistance zone, where supply has visibly emerged. Despite this, the bullish structure remains intact above the pivot region (~$78,000-$86,000), with higher Fibonacci targets between $114,000 and $124,000 still valid in case the trend resumes.
Daily Chart – Bulls React to Liquidity Sweep
The daily chart reveals that after a failed breakout below the local range—an evident sell-side liquidity grab—buyers stepped in with conviction. Price reclaimed the daily pivot zone (~$104,000–$106,000), which also coincides with the short-term countertrend line. However, price is still to test a dual breakdown zone (marked in green) that remains untested, creating a critical decision point.
A successful break and hold above this reaction zone (~$108,000) could reignite the long-term bullish expansion, targeting the 138.2% and 150% weekly Fibonacci extensions around $114,500–$118,000.
4H Chart – Liquidity Grab and Retest in Play
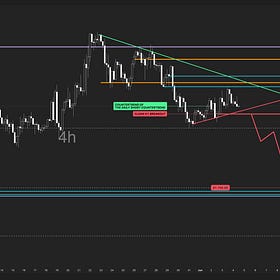
On the 4-hour chart, a nice impulse has reached the H4 target Fibonacci 200, then the bearish breakdown resulted in a liquidity grab just below $101,000, followed by a sharp reversal. This failure of the bears further weakens the short bias unless price breaks below the red level (~$101,900), which marks a clean H1 breakout zone.
Currently, the price is testing the short-term reaction zone (~$105,900–$107,300). If bulls reclaim this level with conviction, the long trend will likely accelerate. On the flip side, rejection here could open a path for a final corrective move back toward the blue Fibonacci level near $97,000, still within the daily correction structure. However, at the sell-side liquidity, the bears should manage their positions.
Conclusion
The market structure is still bullish on the weekly timeframe. However, a short-term countertrend remains valid unless the reaction zone above current price is decisively broken. The weekly impulse signals strength, and the recent liquidity grab suggests that the bears failed to maintain control.
Traders should:
Watch for confirmation above $107,000 for long continuation
Manage any short setups strictly below $101,900
Keep targets aligned with the weekly Fib extensions: $112k, $116k, $118k, and $124k
This analysis is not a forecast. It reflects the structure of the market and the zones where trend alignment across timeframes may trigger expansion phases.
Related post
Bitcoin Turned South on H4 Below The Daily Breakdown
In my recent post Will Bitcoin Make a Deep Correction?, I highlighted the growing pressure beneath Bitcoin’s key resistances and the potential for a bearish continuation deeper in the countertrend space.


