
EVRG | Monthly Expansion Phase Toward 80.95
Multi-timeframe bullish structure continues with a confirmed countertrend break and daily trigger now activated above 77.27

The Market Flow | November 13, 2025
Company Overview
Evergy Inc. is an integrated electric utility serving residential, commercial, and industrial customers across Kansas and Missouri. Revenue is primarily generated through regulated electricity sales supported by a stable rate-base structure. The company operates a diversified generation fleet spanning coal, nuclear, natural gas, wind, and solar, with ongoing investment in grid modernization and renewable capacity.
Evergy Inc. fits the stalwart category — a mature utility with stable cash flow, modest growth, and predictable capital allocation rather than rapid expansion cycles.
Technical Overview
Monthly
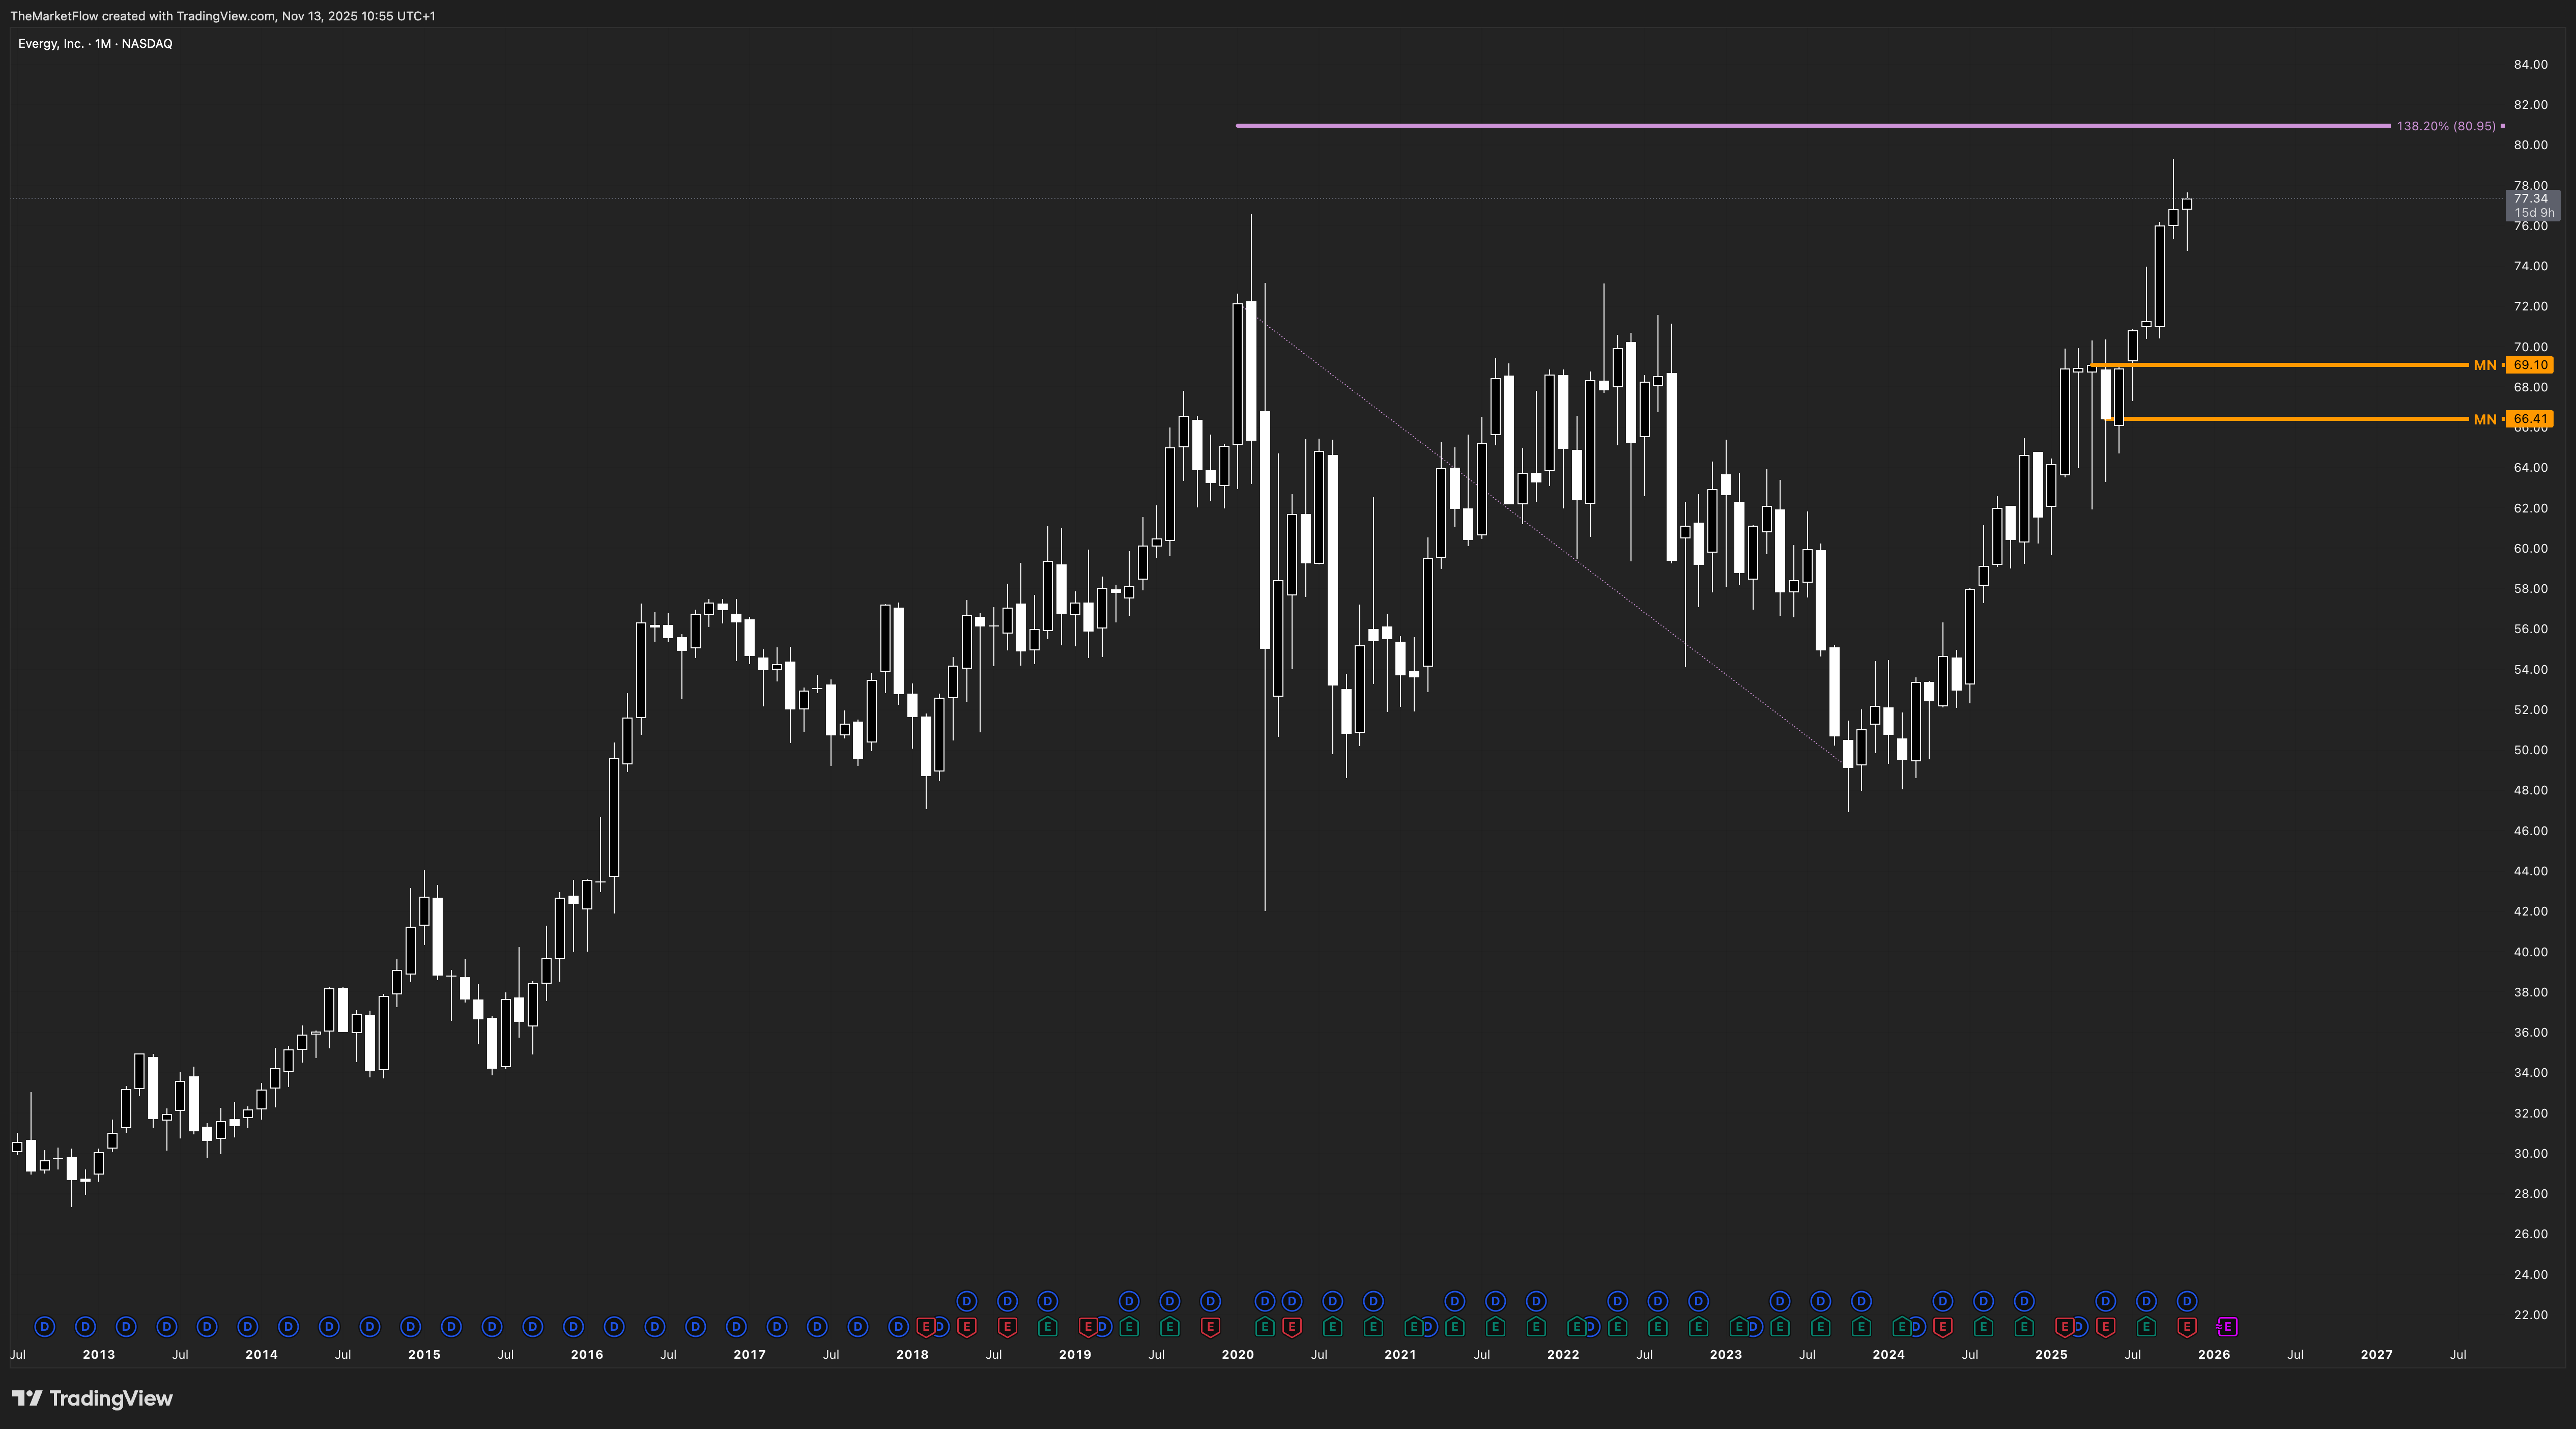
The monthly structure remains firmly in an expansion phase, having cleared the countertrend line and traded decisively above prior structural resistance. The monthly pivot at 66.41 remains intact, anchoring the broader bullish context. Price is advancing toward the 138.2% Fibonacci target at 80.95, which remains fully in scope. Wave progression is consistent with continuation, and no structural exhaustion signals are present at this timeframe.
Weekly
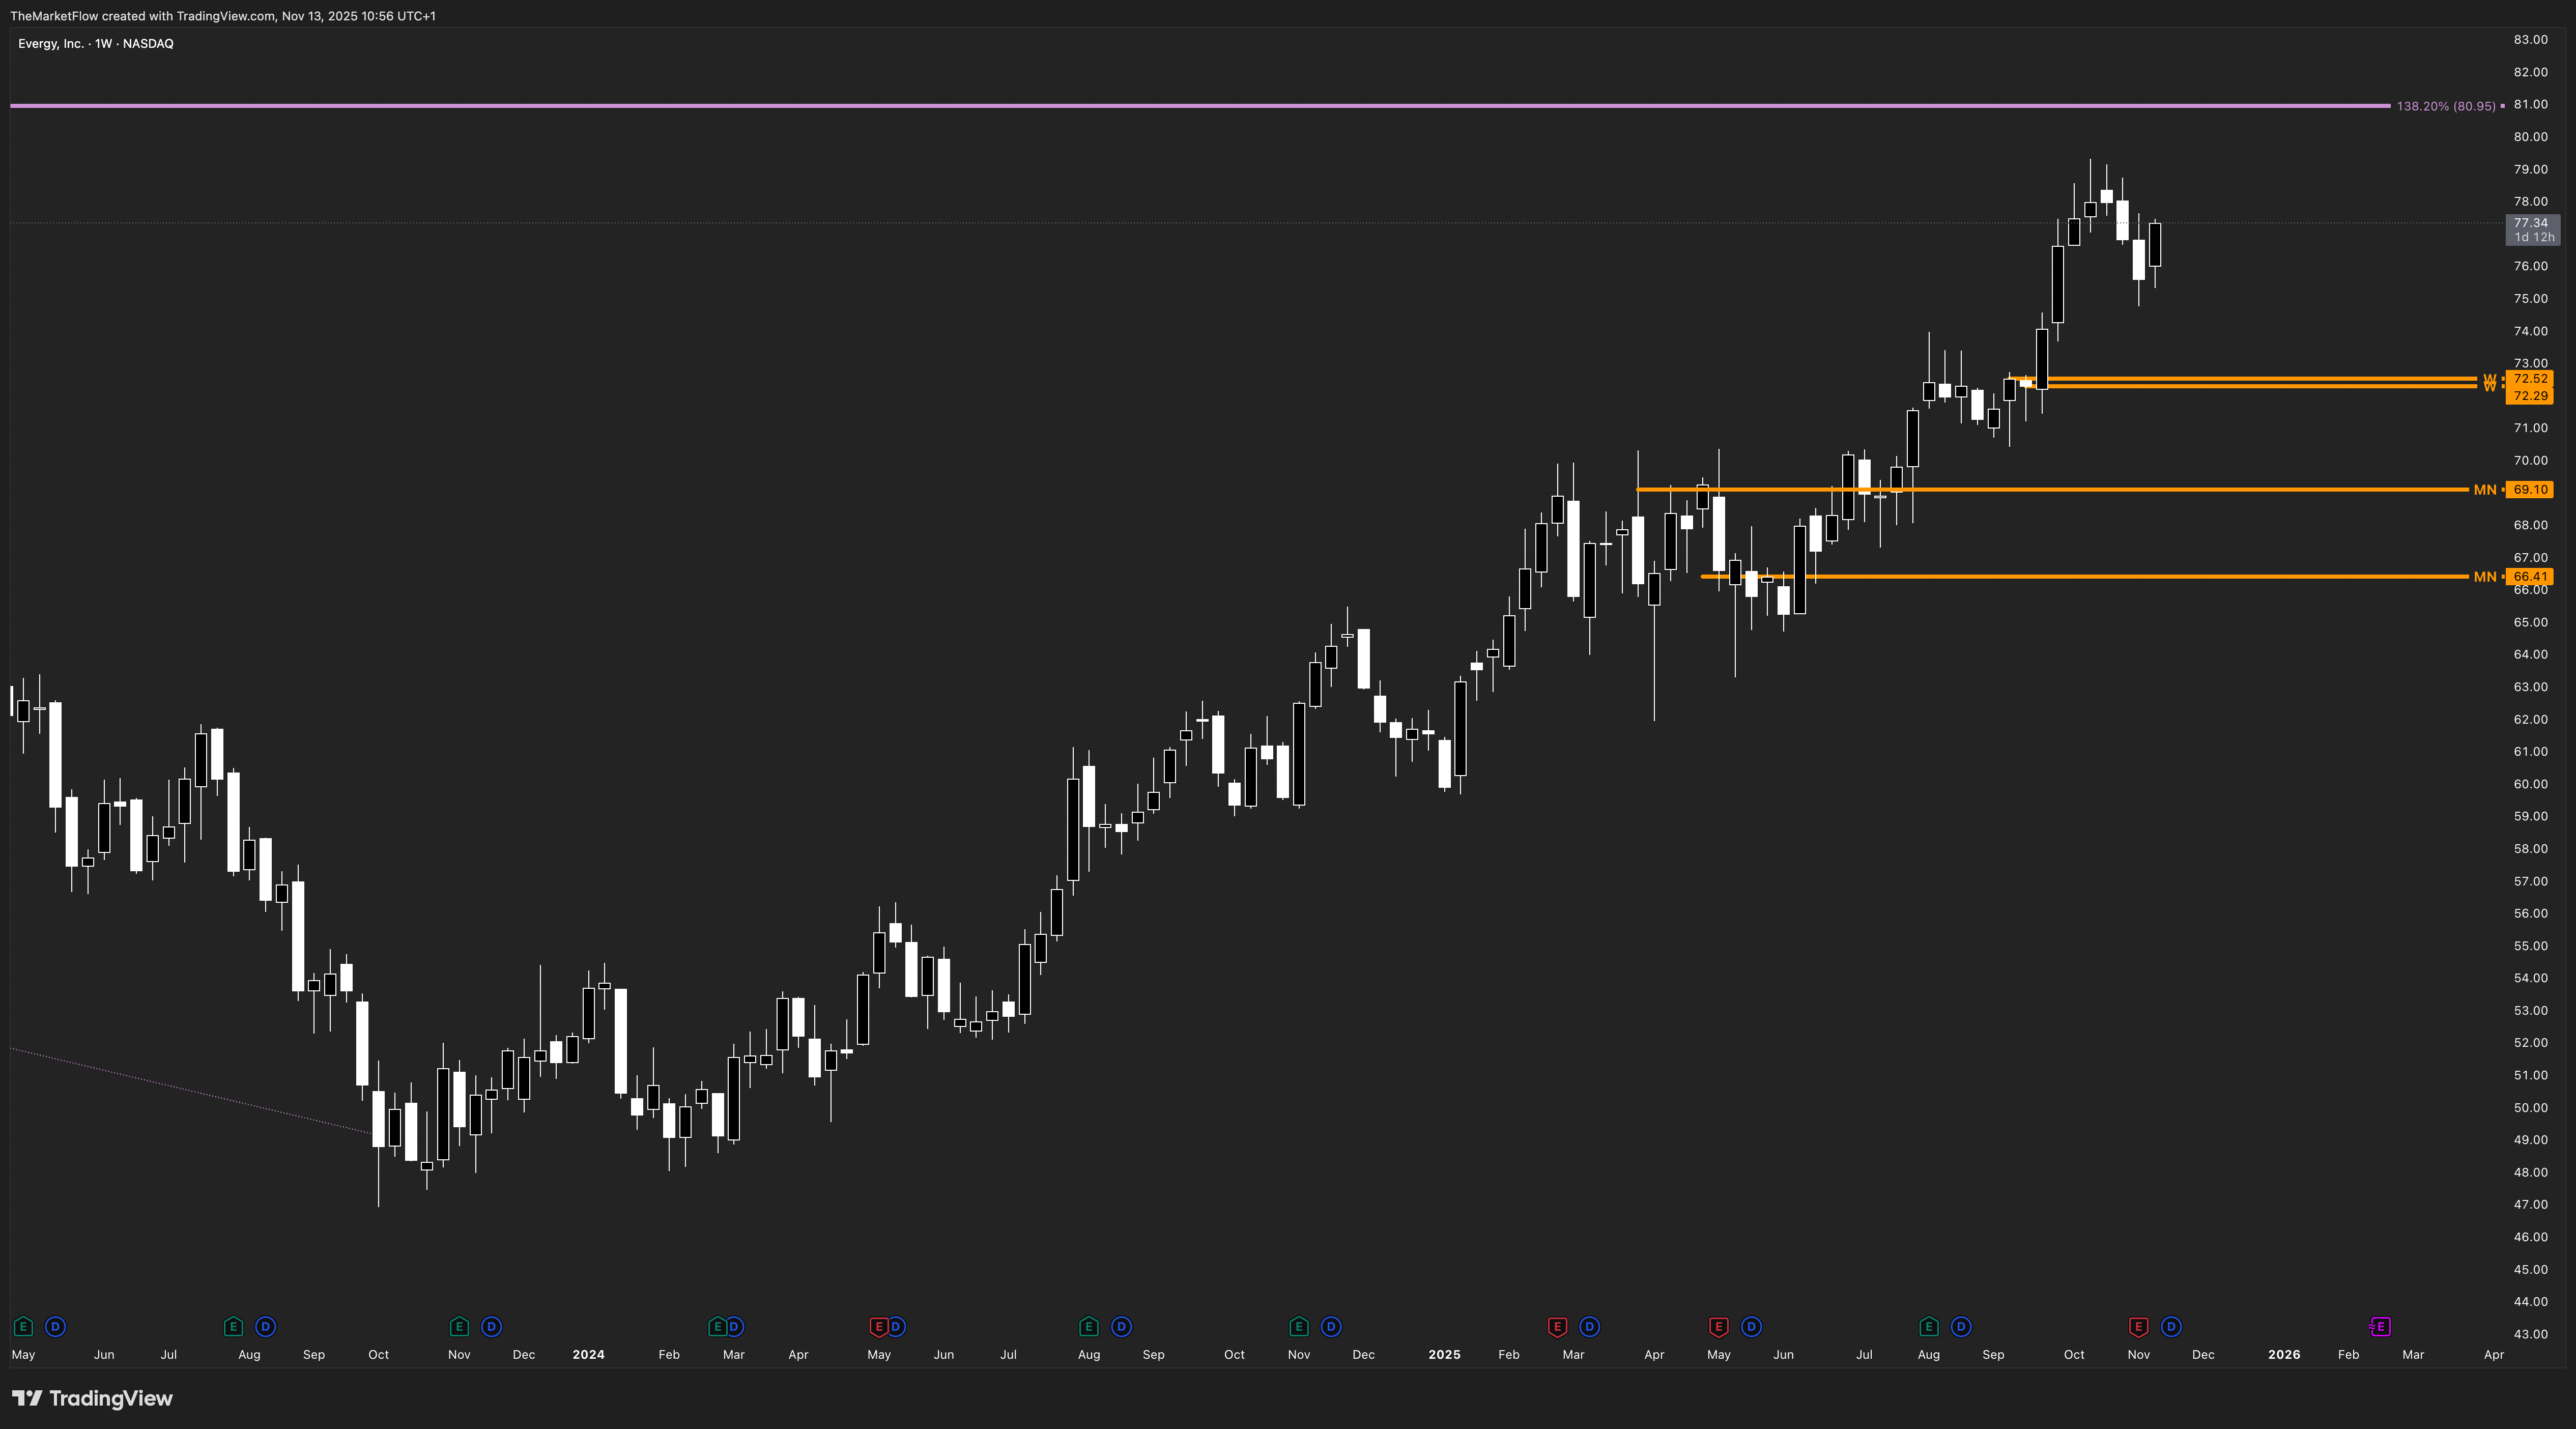
Weekly structure aligns with the monthly bias. Despite a modest pullback, price remains comfortably above the weekly pivot zone at 72.52–72.29, keeping the weekly trend intact. Weekly waves are still upward, but the correction has still some space. The timeframe continues to support a bullish continuation path as long as the pivot zone holds.
Daily
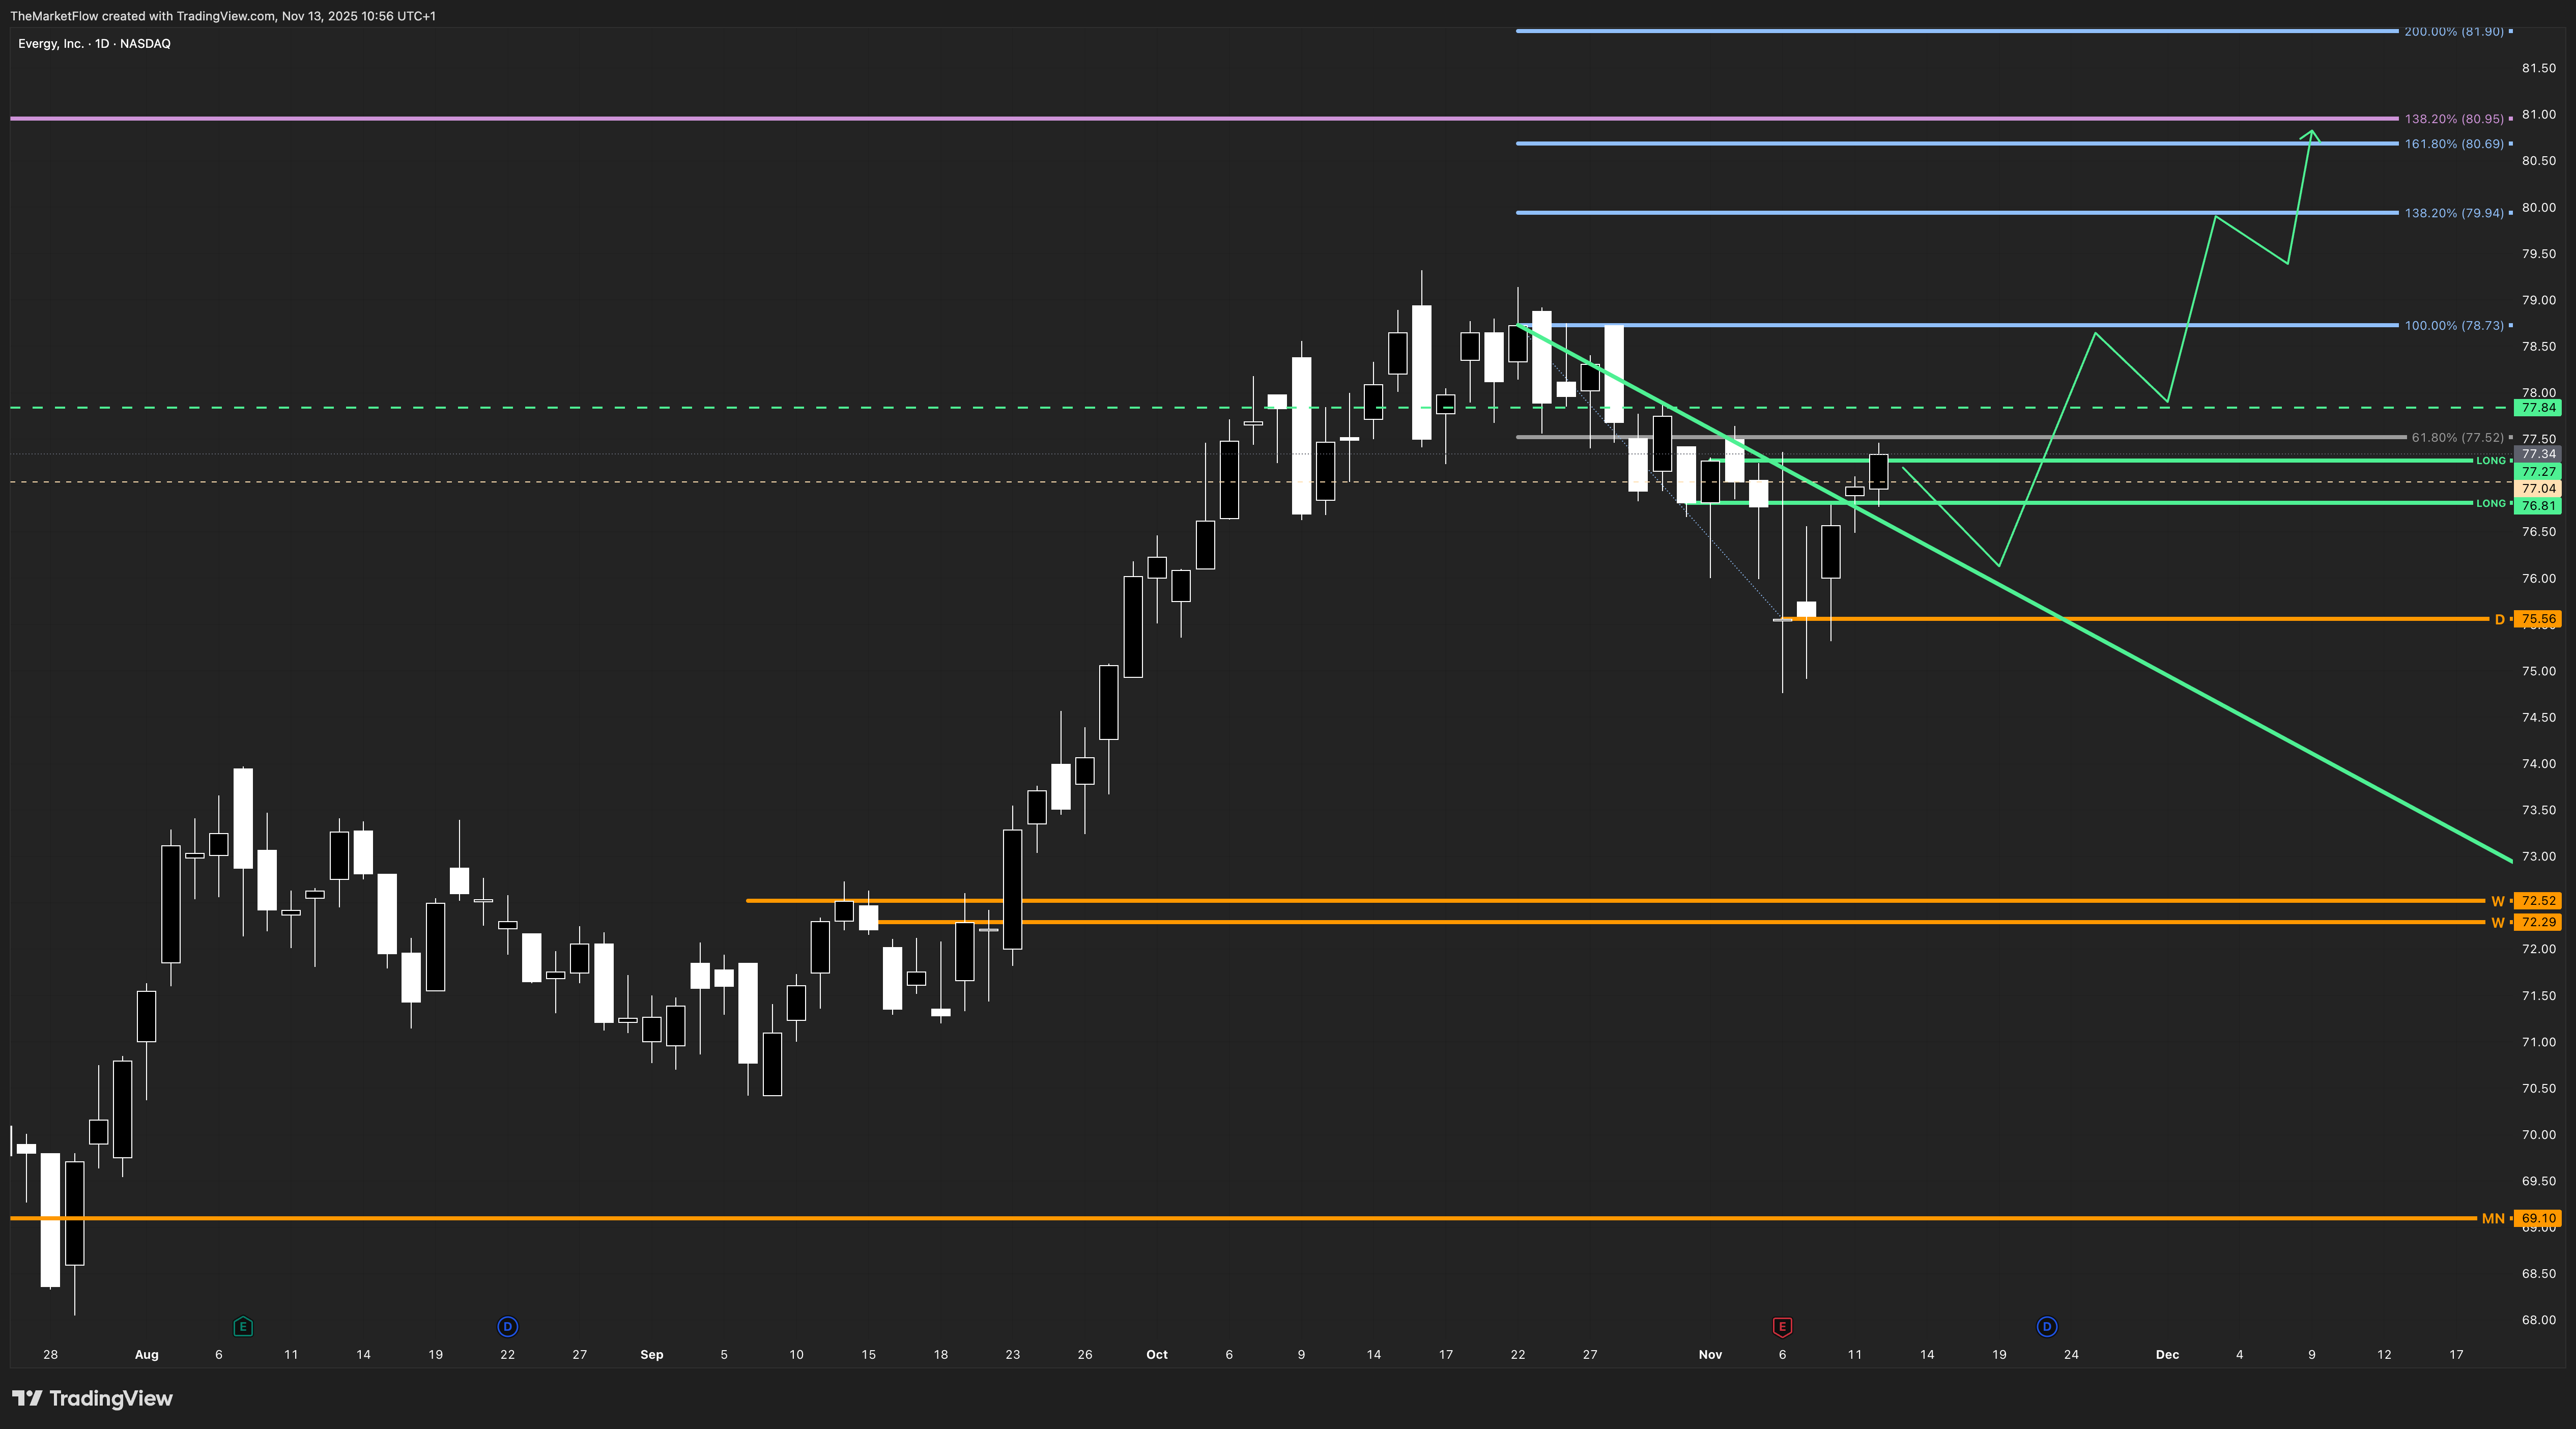
The daily countertrend line has been broken, and the market has printed its first impulsive wave through the trigger zone. The daily trigger is a confirmed daily close above 77.27, which has activated the structure. As long as the daily pivot at 75.56 remains intact, the countertrend break is valid. The active targets are the Fibonacci levels at 78.73, 79.94, and the higher-timeframe objective near 80.95.
The green dashed level at 77.84 is the current VAH drawn on the correction.
H4
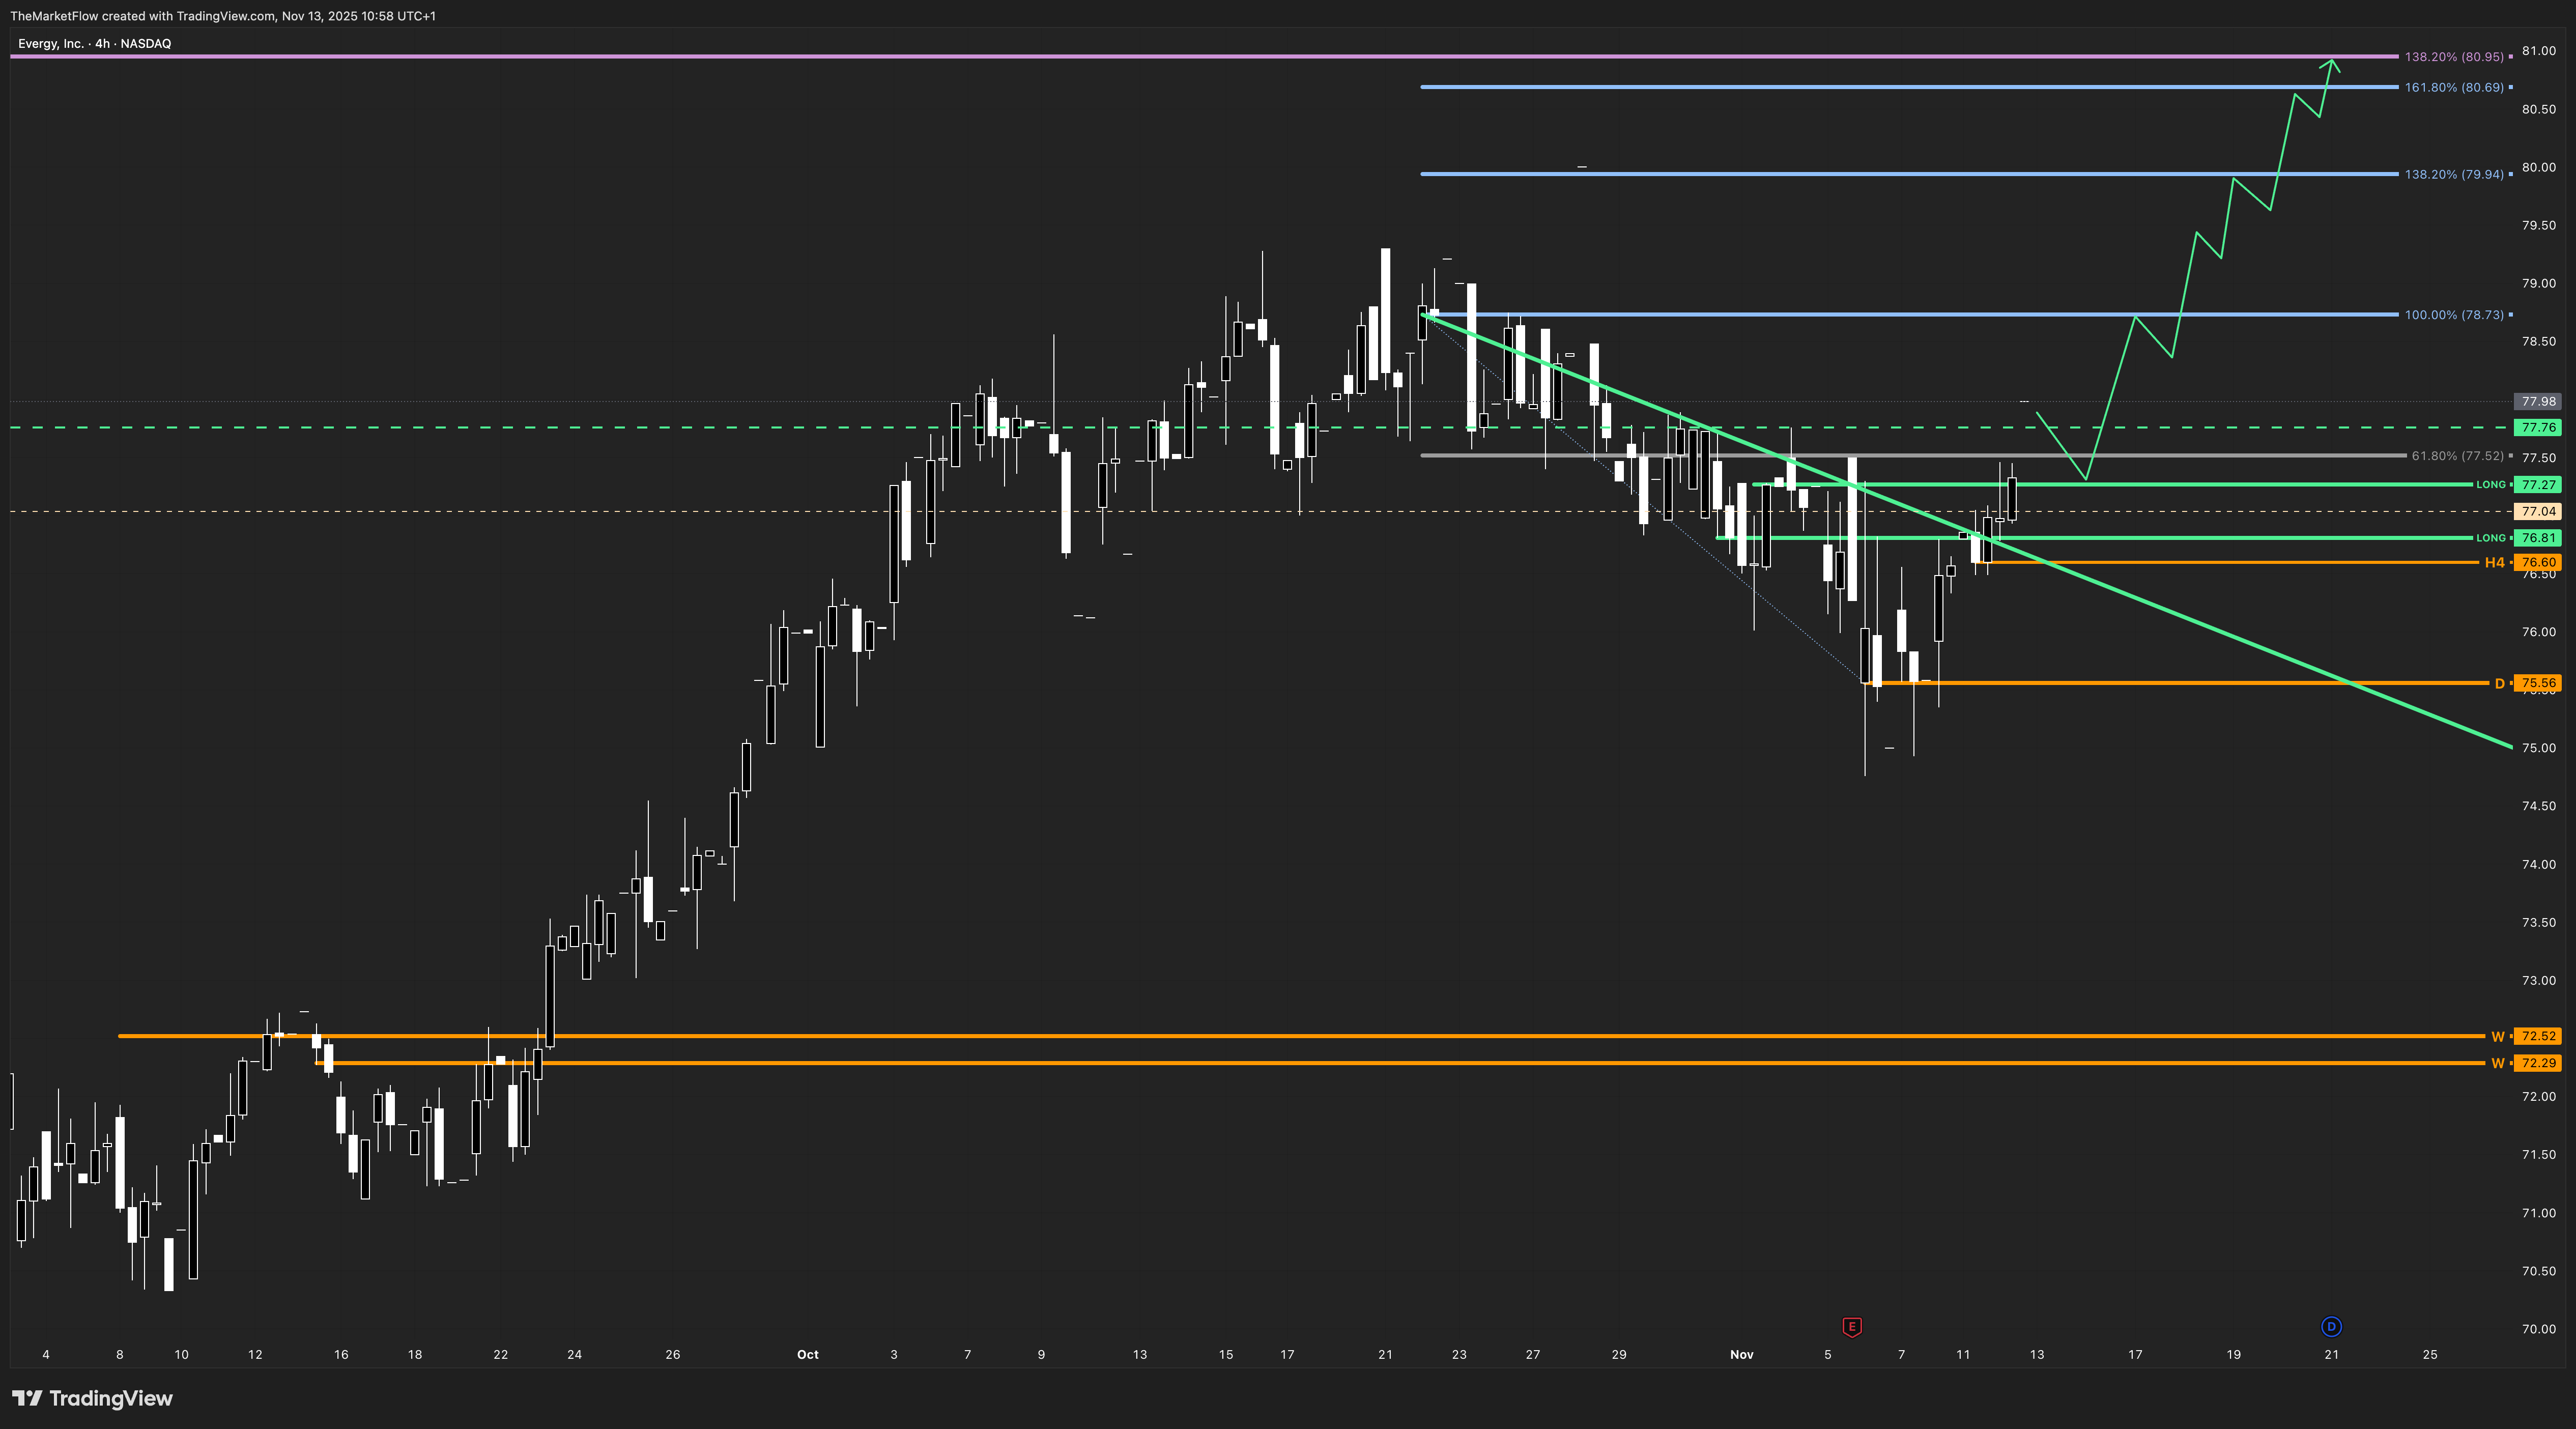
H4 continues to follow through with aligned upward wave structure after the daily trigger confirmation. Retracements remain orderly and corrective, functioning as pullbacks within the broader expansion. As long as H4 waves remain pointed upward and the daily pivot holds, the timeframe reinforces continuation toward the higher daily and monthly expansion levels.
Trade Structure & Levels
Bias: Long above 72.52 (weekly pivot)
Phase: Daily Countertrend Break → Monthly Expansion
Trigger: Daily close above 77.27
Invalidation: H4 close below 76.60 (short-term) | Daily close below 75.56
Path → Daily Fibonacci targets 78.73, 79.94, and monthly 138.2% at 80.95
ATR(14D): Approx. 1.20
Volume(20D): Approx. 1.3M–1.5M shares
Risk & Event Context
Utilities remain sensitive to rate expectations, and upcoming macro releases on inflation or Fed communication can influence sector flows. Earnings-related guidance shifts may introduce short-term volatility. Broader energy-market shifts or regulatory announcements regarding generation mix could temporarily affect risk perception.
Conclusion
The market has confirmed a daily trigger above 77.27, aligning daily and H4 flows with the ongoing monthly expansion. As long as the daily pivot at 75.56 remains intact, structural continuation toward the remaining Fibonacci targets and the monthly 138.2% objective at 80.95 remains the dominant path.
Disclaimer
This publication is provided for informational and educational purposes only and does not constitute investment advice, a solicitation, or a recommendation to buy or sell any security, derivative, or financial instrument. The analysis and opinions expressed reflect the author’s views at the time of writing and are subject to change without notice.
All information is derived from publicly available sources believed to be reliable, but accuracy and completeness are not guaranteed. Past performance is not indicative of future results, and no representation or warranty is made regarding future price behavior or outcomes.
Readers are solely responsible for their own investment decisions and should consult a qualified financial advisor before acting on any information contained herein.
The author and/or affiliates may hold, trade, or have a financial interest in the securities or instruments mentioned in this publication. Neither the author nor any associated party accepts liability for any direct or consequential loss arising from the use of this material.