
EURUSD: Daily Correction After Reaching Weekly Fibonacci Target
How retests of 1.1551 and 1.1444 can ignite a rally toward 1.1730 or resume the pullback.

Monthly Analysis: Bearish Megatrend Meets Countertrend Zone
On the monthly chart, the pair continues to trace lower highs and lower lows, confirming the prevailing bearish megatrend.
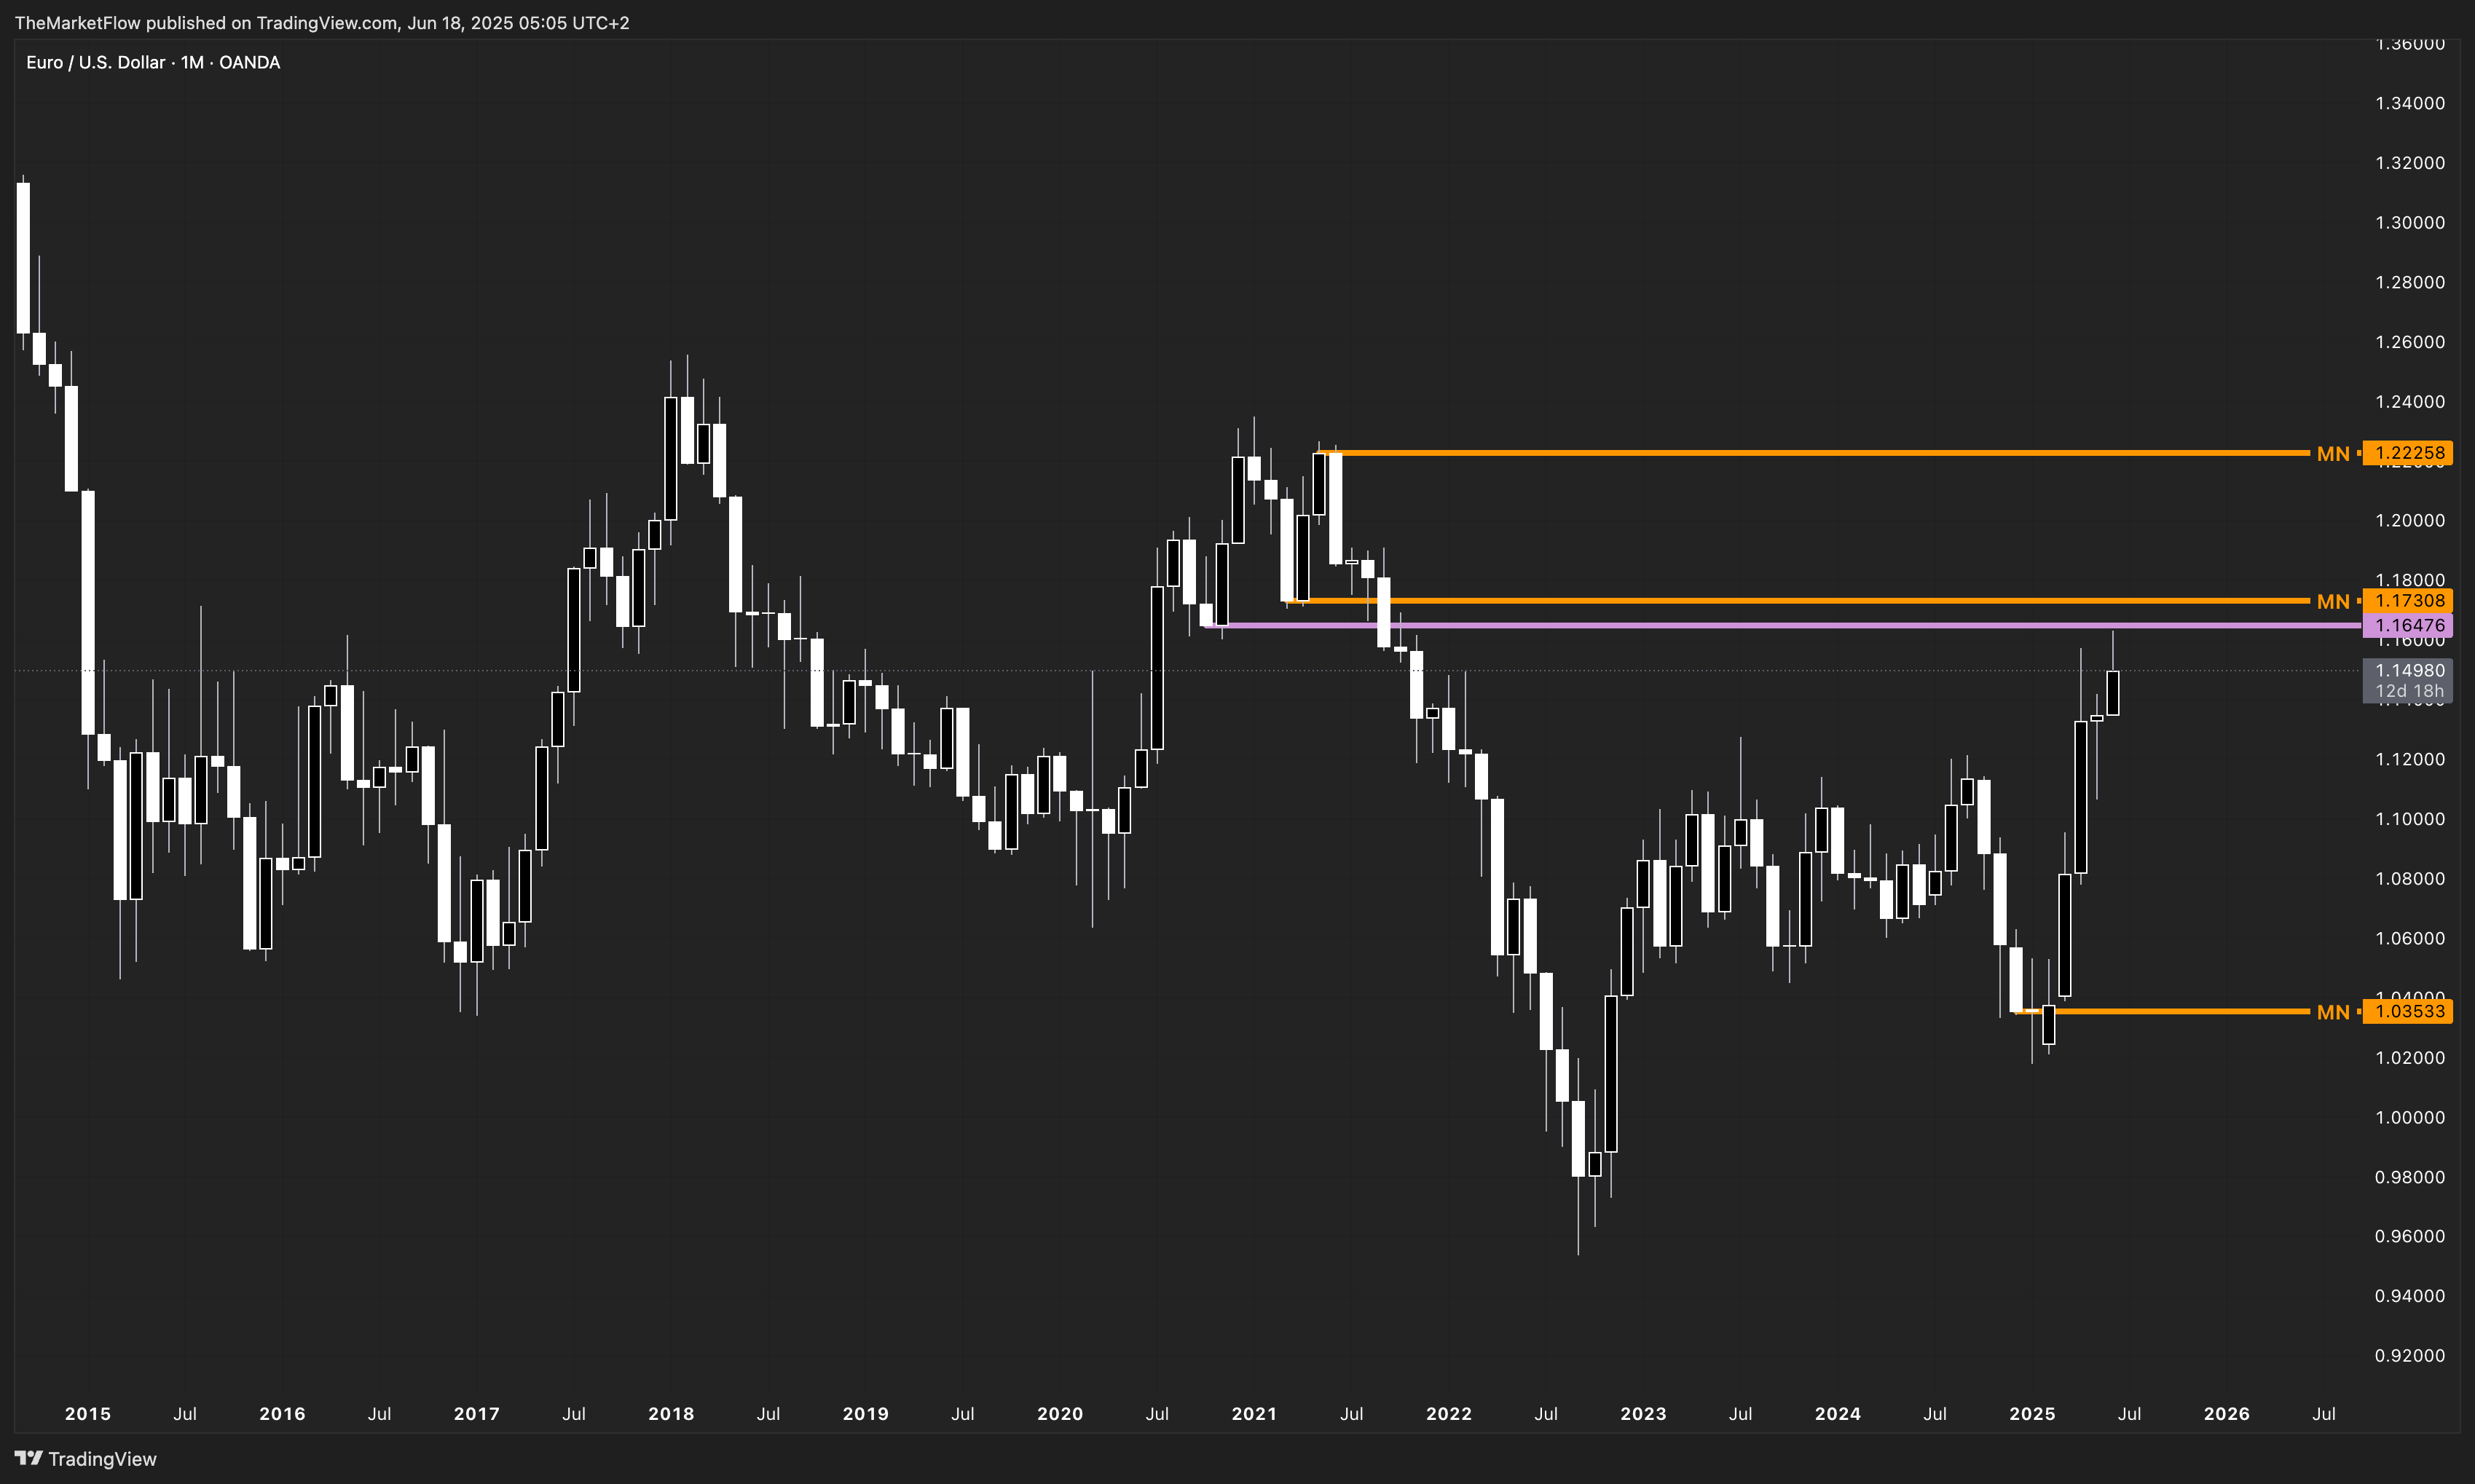
However, the recent advance has carried price into the lower boundary of the monthly breakdown zone—around 1.1647. This zone now serves as the ultimate battleground: a convincing monthly close above 1.1699 would signal a shift in control toward buyers and open the door to 1.1730 and higher monthly resistance levels. Until that break occurs, the broader trend remains favoring the downside.
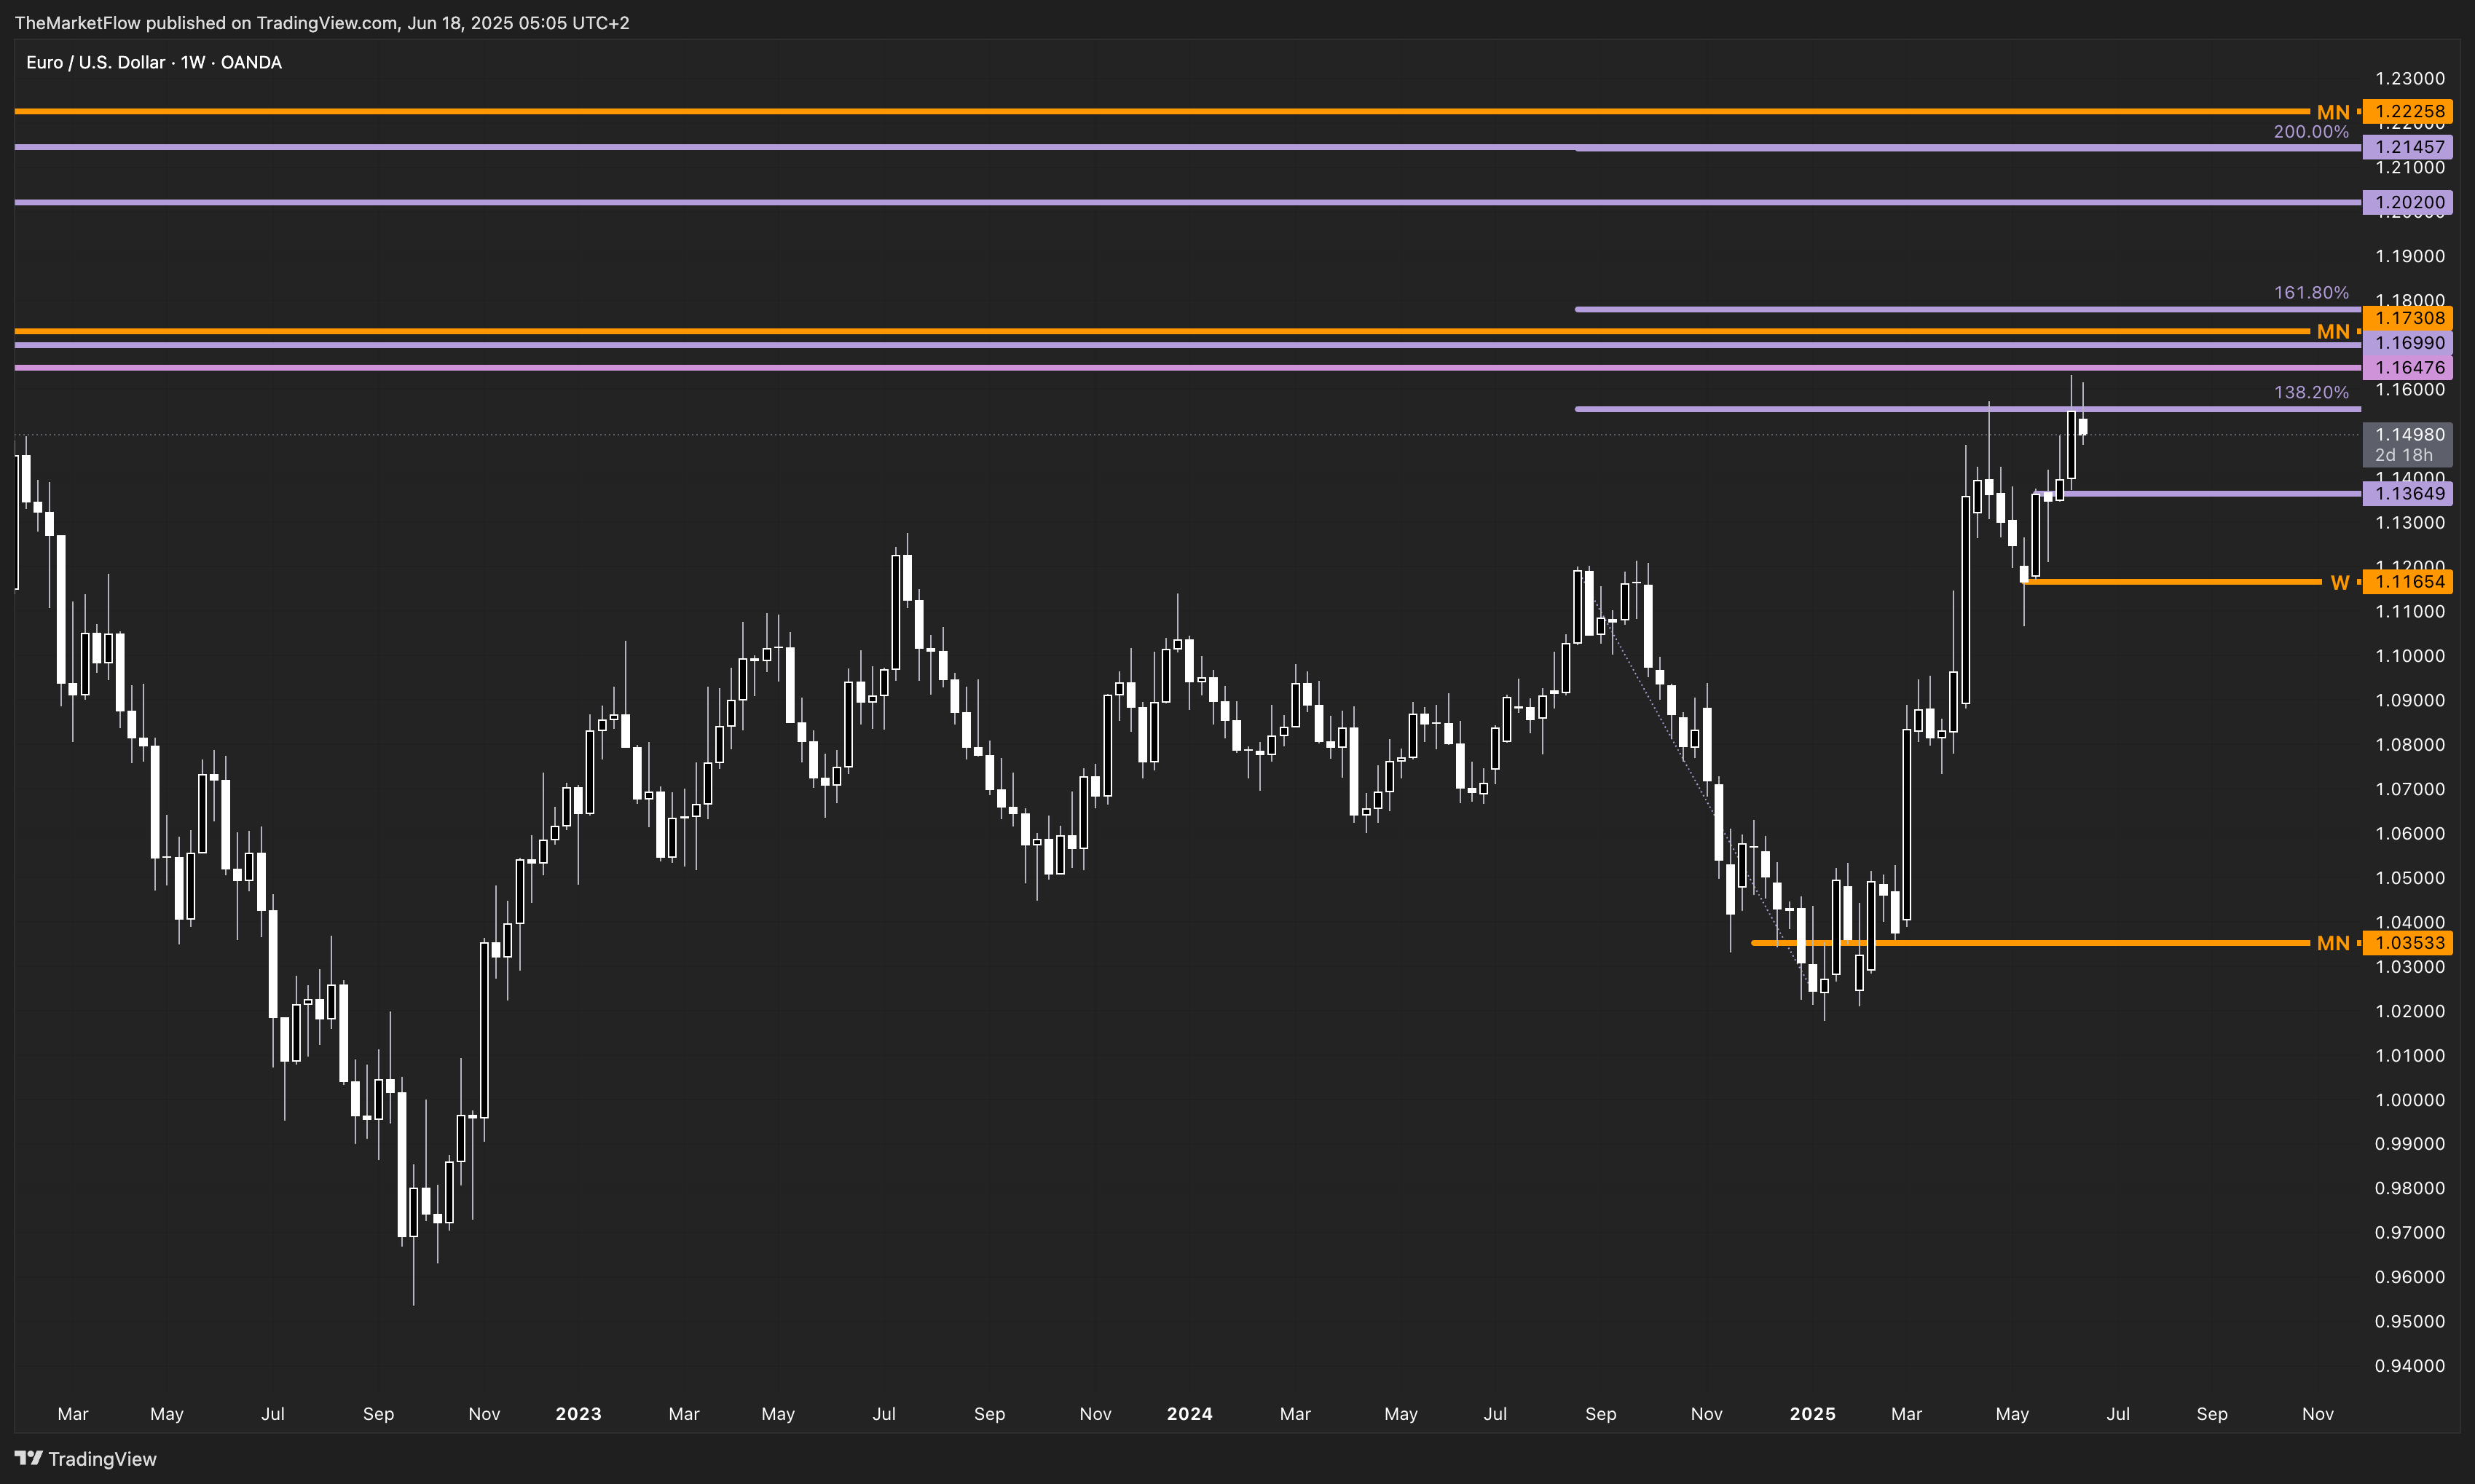
Weekly Analysis: Fibonacci Cap and Support Pivot
Since April, the pair climbed to the 138.2% Fibonacci extension of the April–May swing, roughly between 1.1480 and 1.1500. This level has emerged as a natural ceiling, repeatedly stalling upside momentum. Beneath price, the weekly pivot at 1.1365 has held as support; maintaining this level is essential to preserving any longer-term recovery prospects.
A breakdown below 1.1365 would rekindle the broader downtrend, whereas its defense keeps the countertrend scenario alive.
Daily Analysis: Correction Zone and the Green Trigger
On the daily timeframe, recent candles have retraced into the correction zone, spanning 1.1444 down to 1.1397. This band now acts as a demand area where countertrend buyers may step in. Above the current range, the confluence of the daily and H4 down-trendlines meets at 1.1551—our trigger zone.
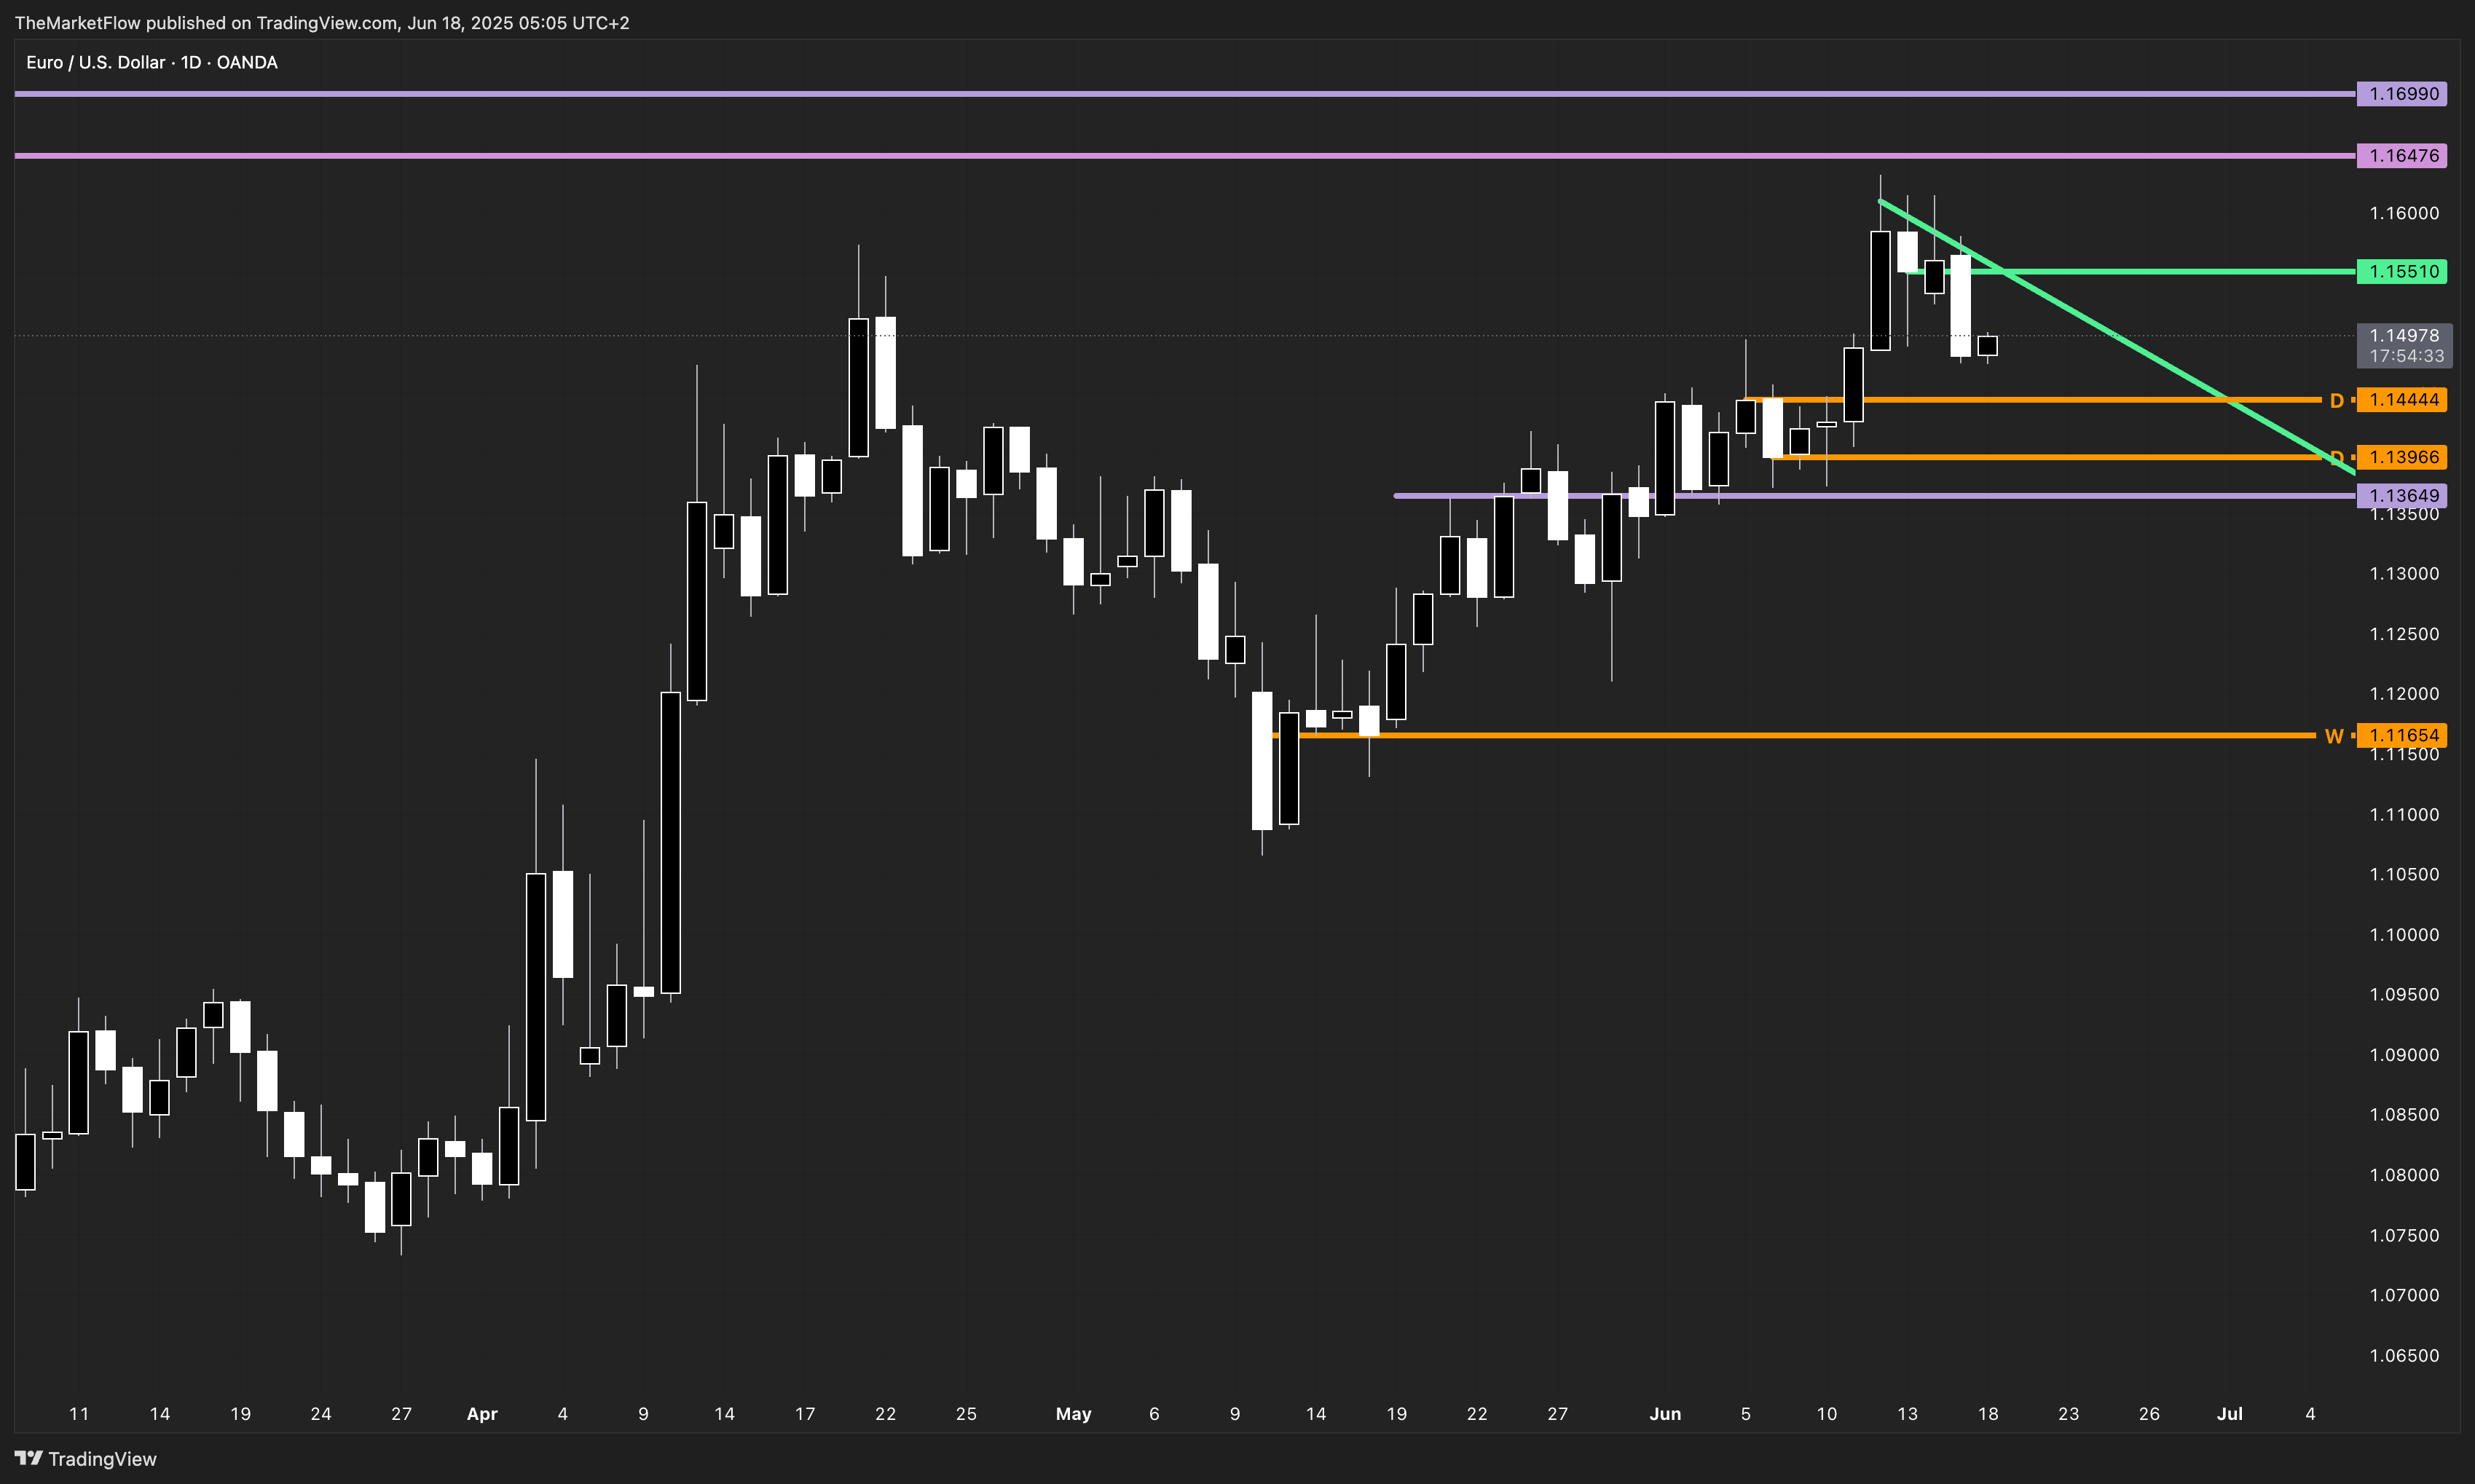
A daily close above it would confirm renewed bullish intent and invite a move back toward weekly Fibonacci extensions and the monthly breakdown zone. Failure to reclaim this level would likely draw price deeper into the orange zone, testing the strength of bears as they defend lower pivots.
Intraday/H4 Analysis: Awaiting Confirmation
The 4-hour chart mirrors the daily structure. Intraday prices have pierced the down-trendline drawn from recent highs, yet a confirmed breakout demands a H4 close above 1.1551.

Until that confirmation arrives, intraday swings are vulnerable to reversal. With each dip toward the orange correction zone, sellers face mounting risk—especially as price nears the daily pivot zone at 1.1396-1.1444, where technical interest from buyers may intensify.
Conclusion
EUR/USD remains anchored by its monthly bearish trend, yet a valid countertrend rally is in play.
The level at 1.1551 serves as the fulcrum: a sustained break higher will shift focus toward weekly and monthly resistance, while rejection will deepen the pullback into the correction zone.
Patience, precision, and respect for these technical thresholds will be crucial as the market decides its next major move.
If you found this analysis helpful, please hit like and share your thoughts in the comments below. Your feedback drives the next deep dive—and it means the world to me!