
EUR/USD – Break of H4 Structure Signals Short-Term Correction
Long trend meets resistance at weekly 161.8% Fib; potential H4 correction toward lower support levels

Market Overview
EUR/USD continues its long-term bullish trend, with price recently extending into the weekly 161.8% target Fibonacci at 1.17777. While higher timeframes still suggest upside potential—particularly toward the monthly breakdown and daily 200% target Fibonacci—the H4 structure has now been broken, indicating a potential countertrend correction in the short term.
Long-Term Outlook
On the monthly and weekly charts, the long expansion phase remains intact. The current leg has reached a critical resistance at 1.17777 (Weekly 161.8%), slightly below the Monthly breakdown at 1.18566. This zone may act as a supply area and cause a short-term pause or reversal, particularly if lower timeframes confirm structural breaks.
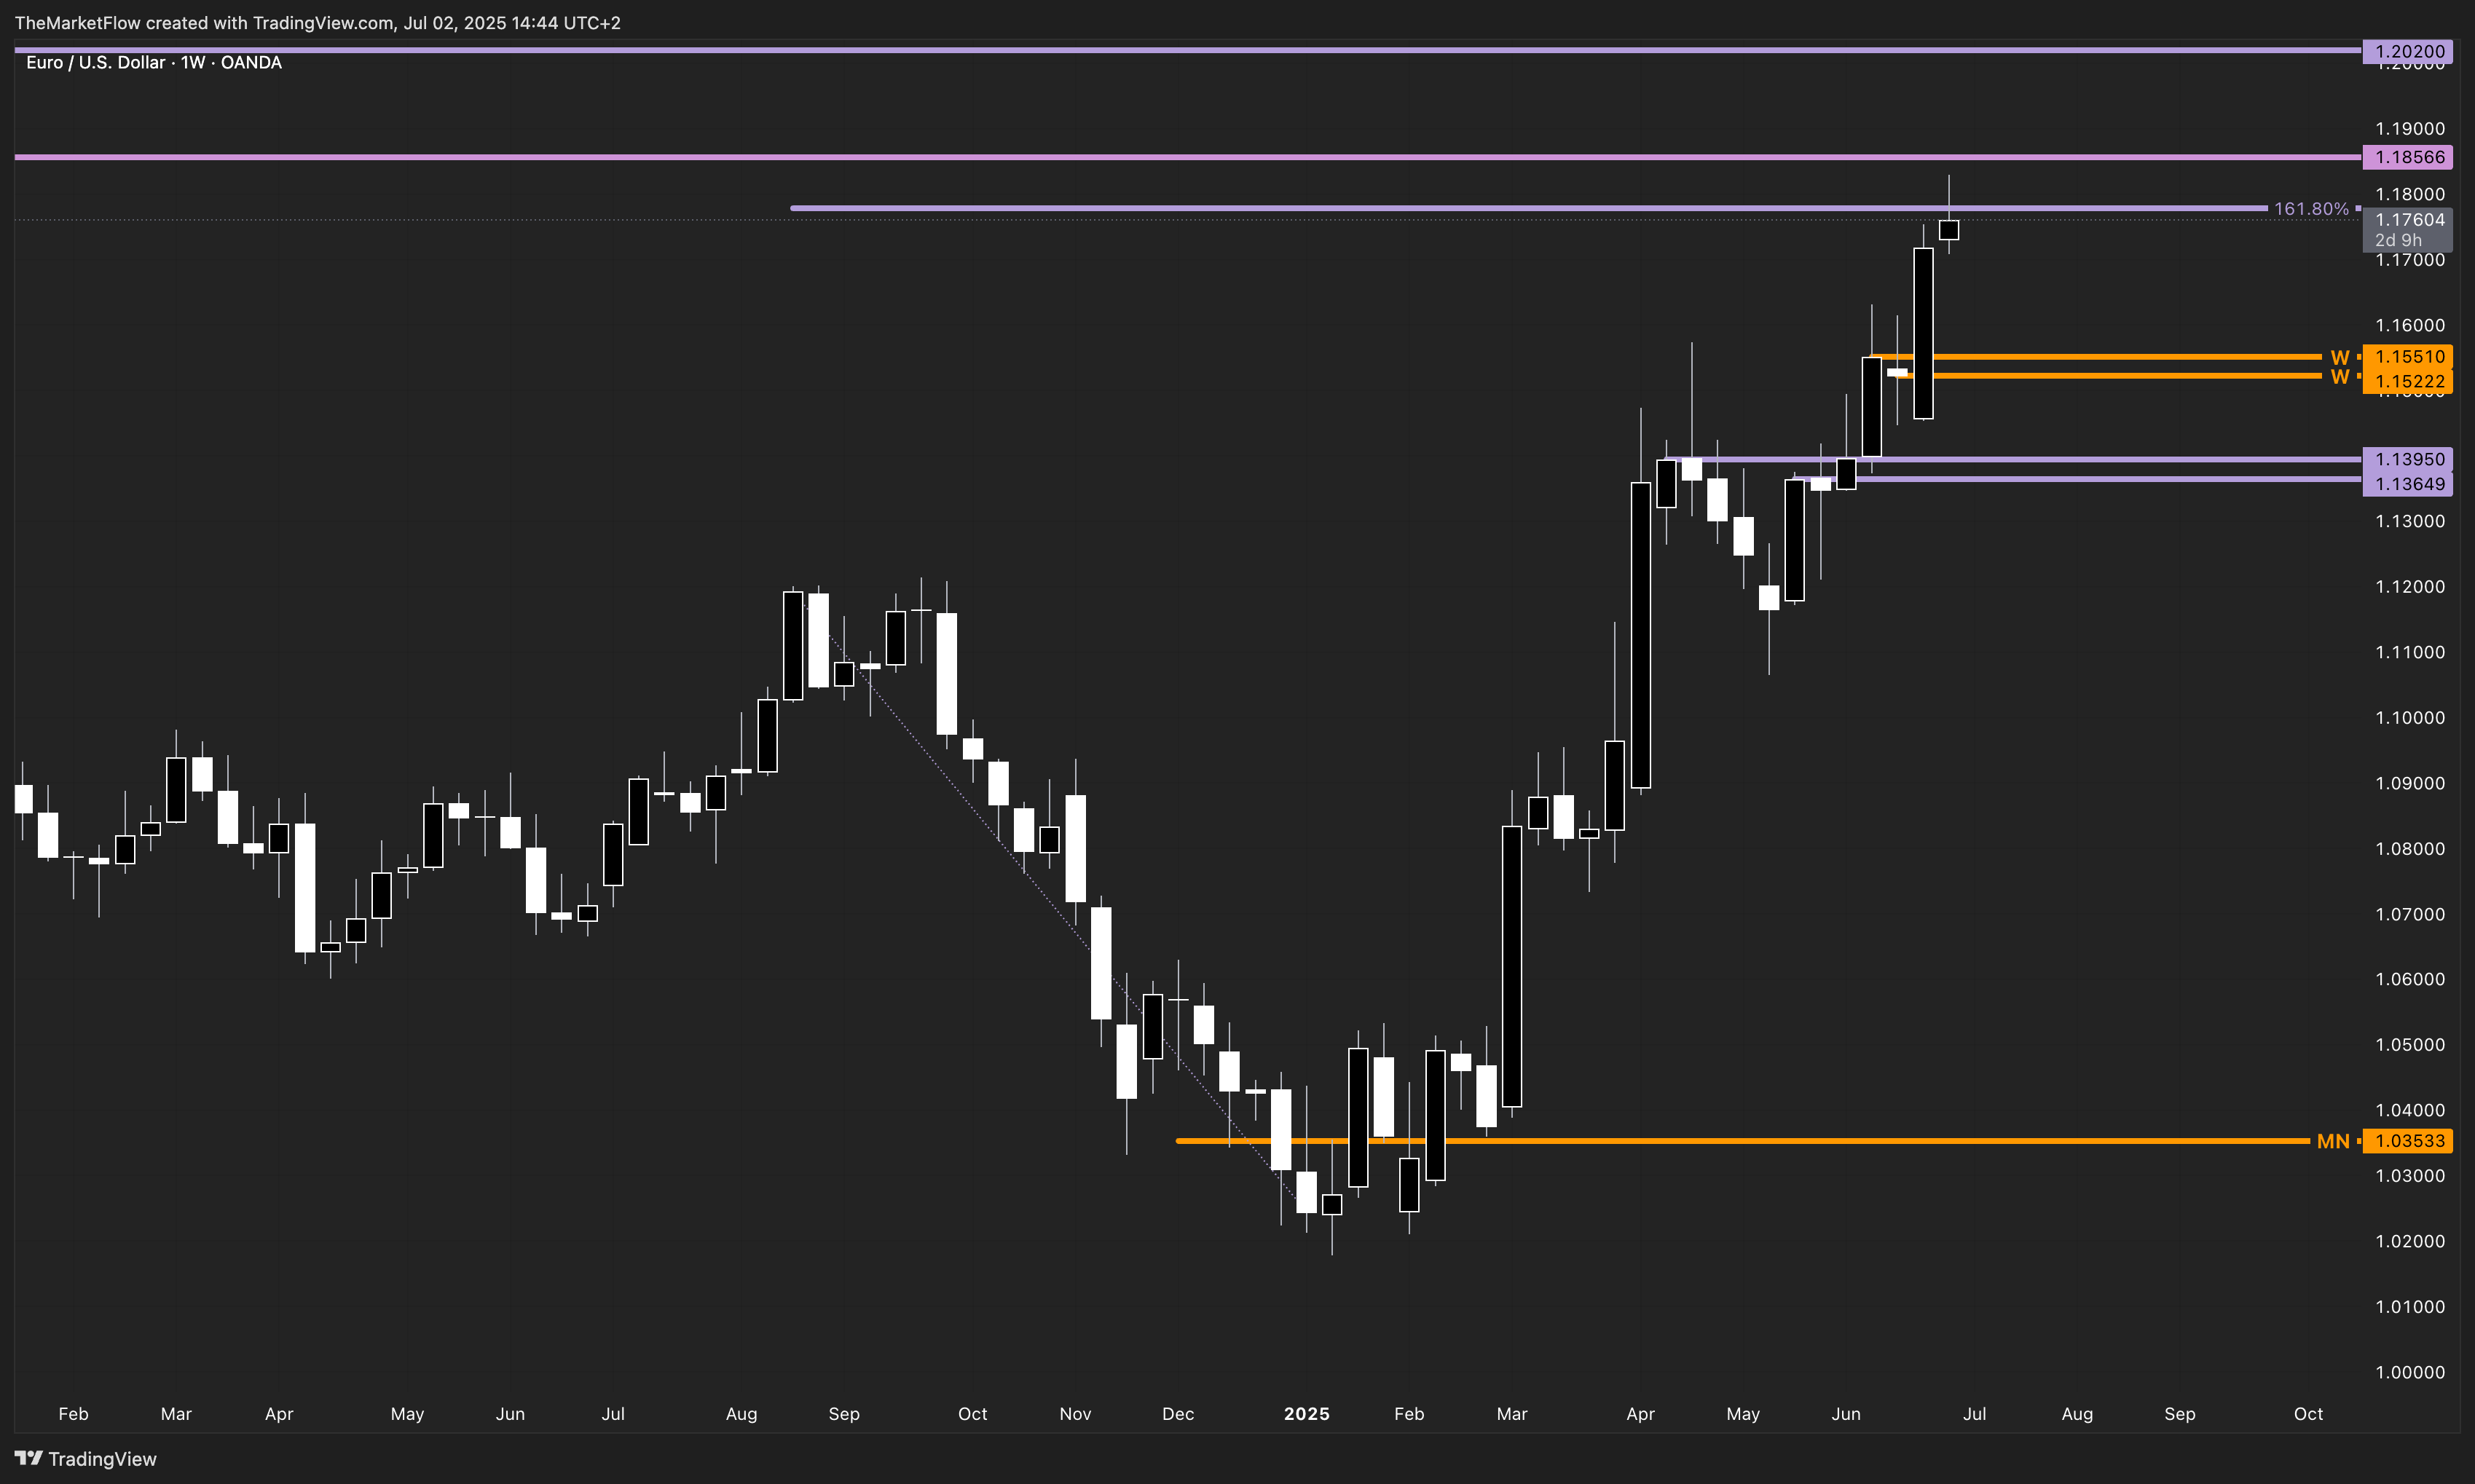
The weekly close below 1.15222 (Weekly Pivot) invalidates the bullish trend structure. The emergence of supply around the current levels warrants a closer look at correction potential.
The Daily Chart
The daily structure remains bullish with consecutive higher highs and higher lows. The price recently extended through the daily 161.8% target Fibonacci and is approaching the daily 200% target Fibonacci, located above 1.19350, indicating the long trend still has room to expand—assuming lower timeframe support holds.
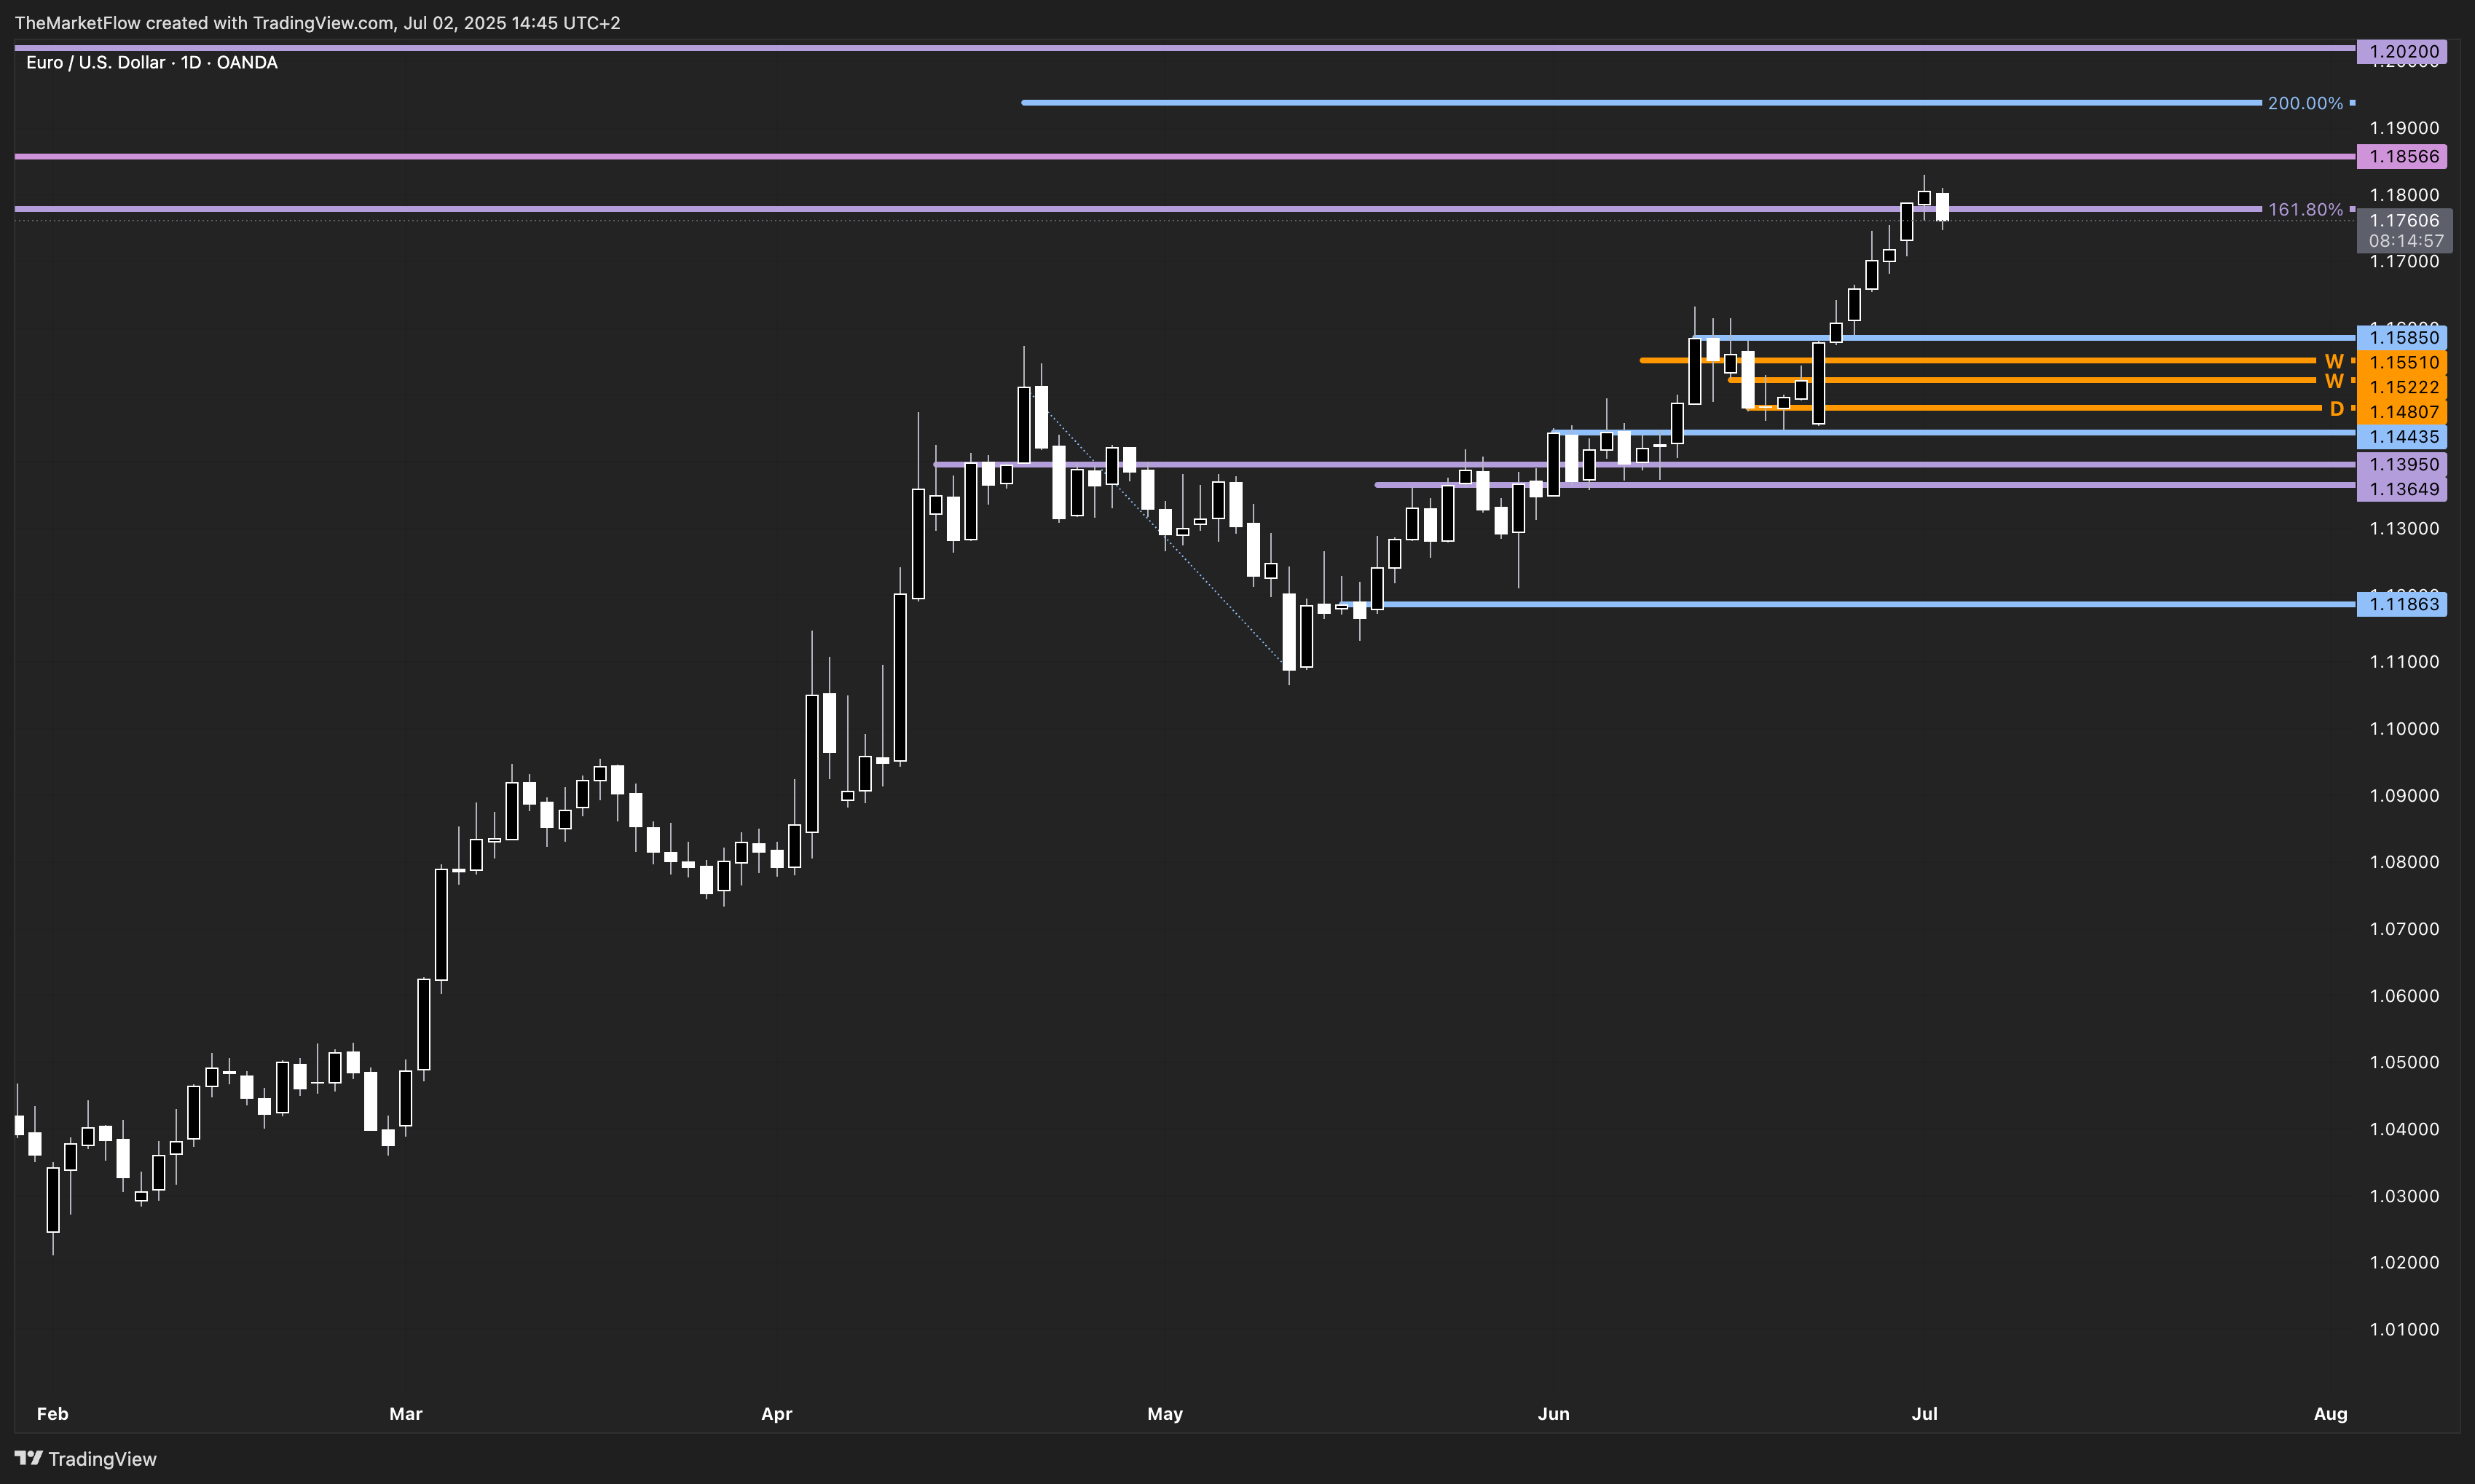
Any pullback remains a correction within the long trend unless daily pivot support at 1.14807 is broken.
Short-Term Dynamics
On the H4 chart, the structure has broken down after a post-ADP data reaction, in spite of its USD negative nature, suggesting the start of a countertrend move. Price rejected from the upper range and closed below the H4 pivot at 1.17655, which marks a confirmed break of structure.
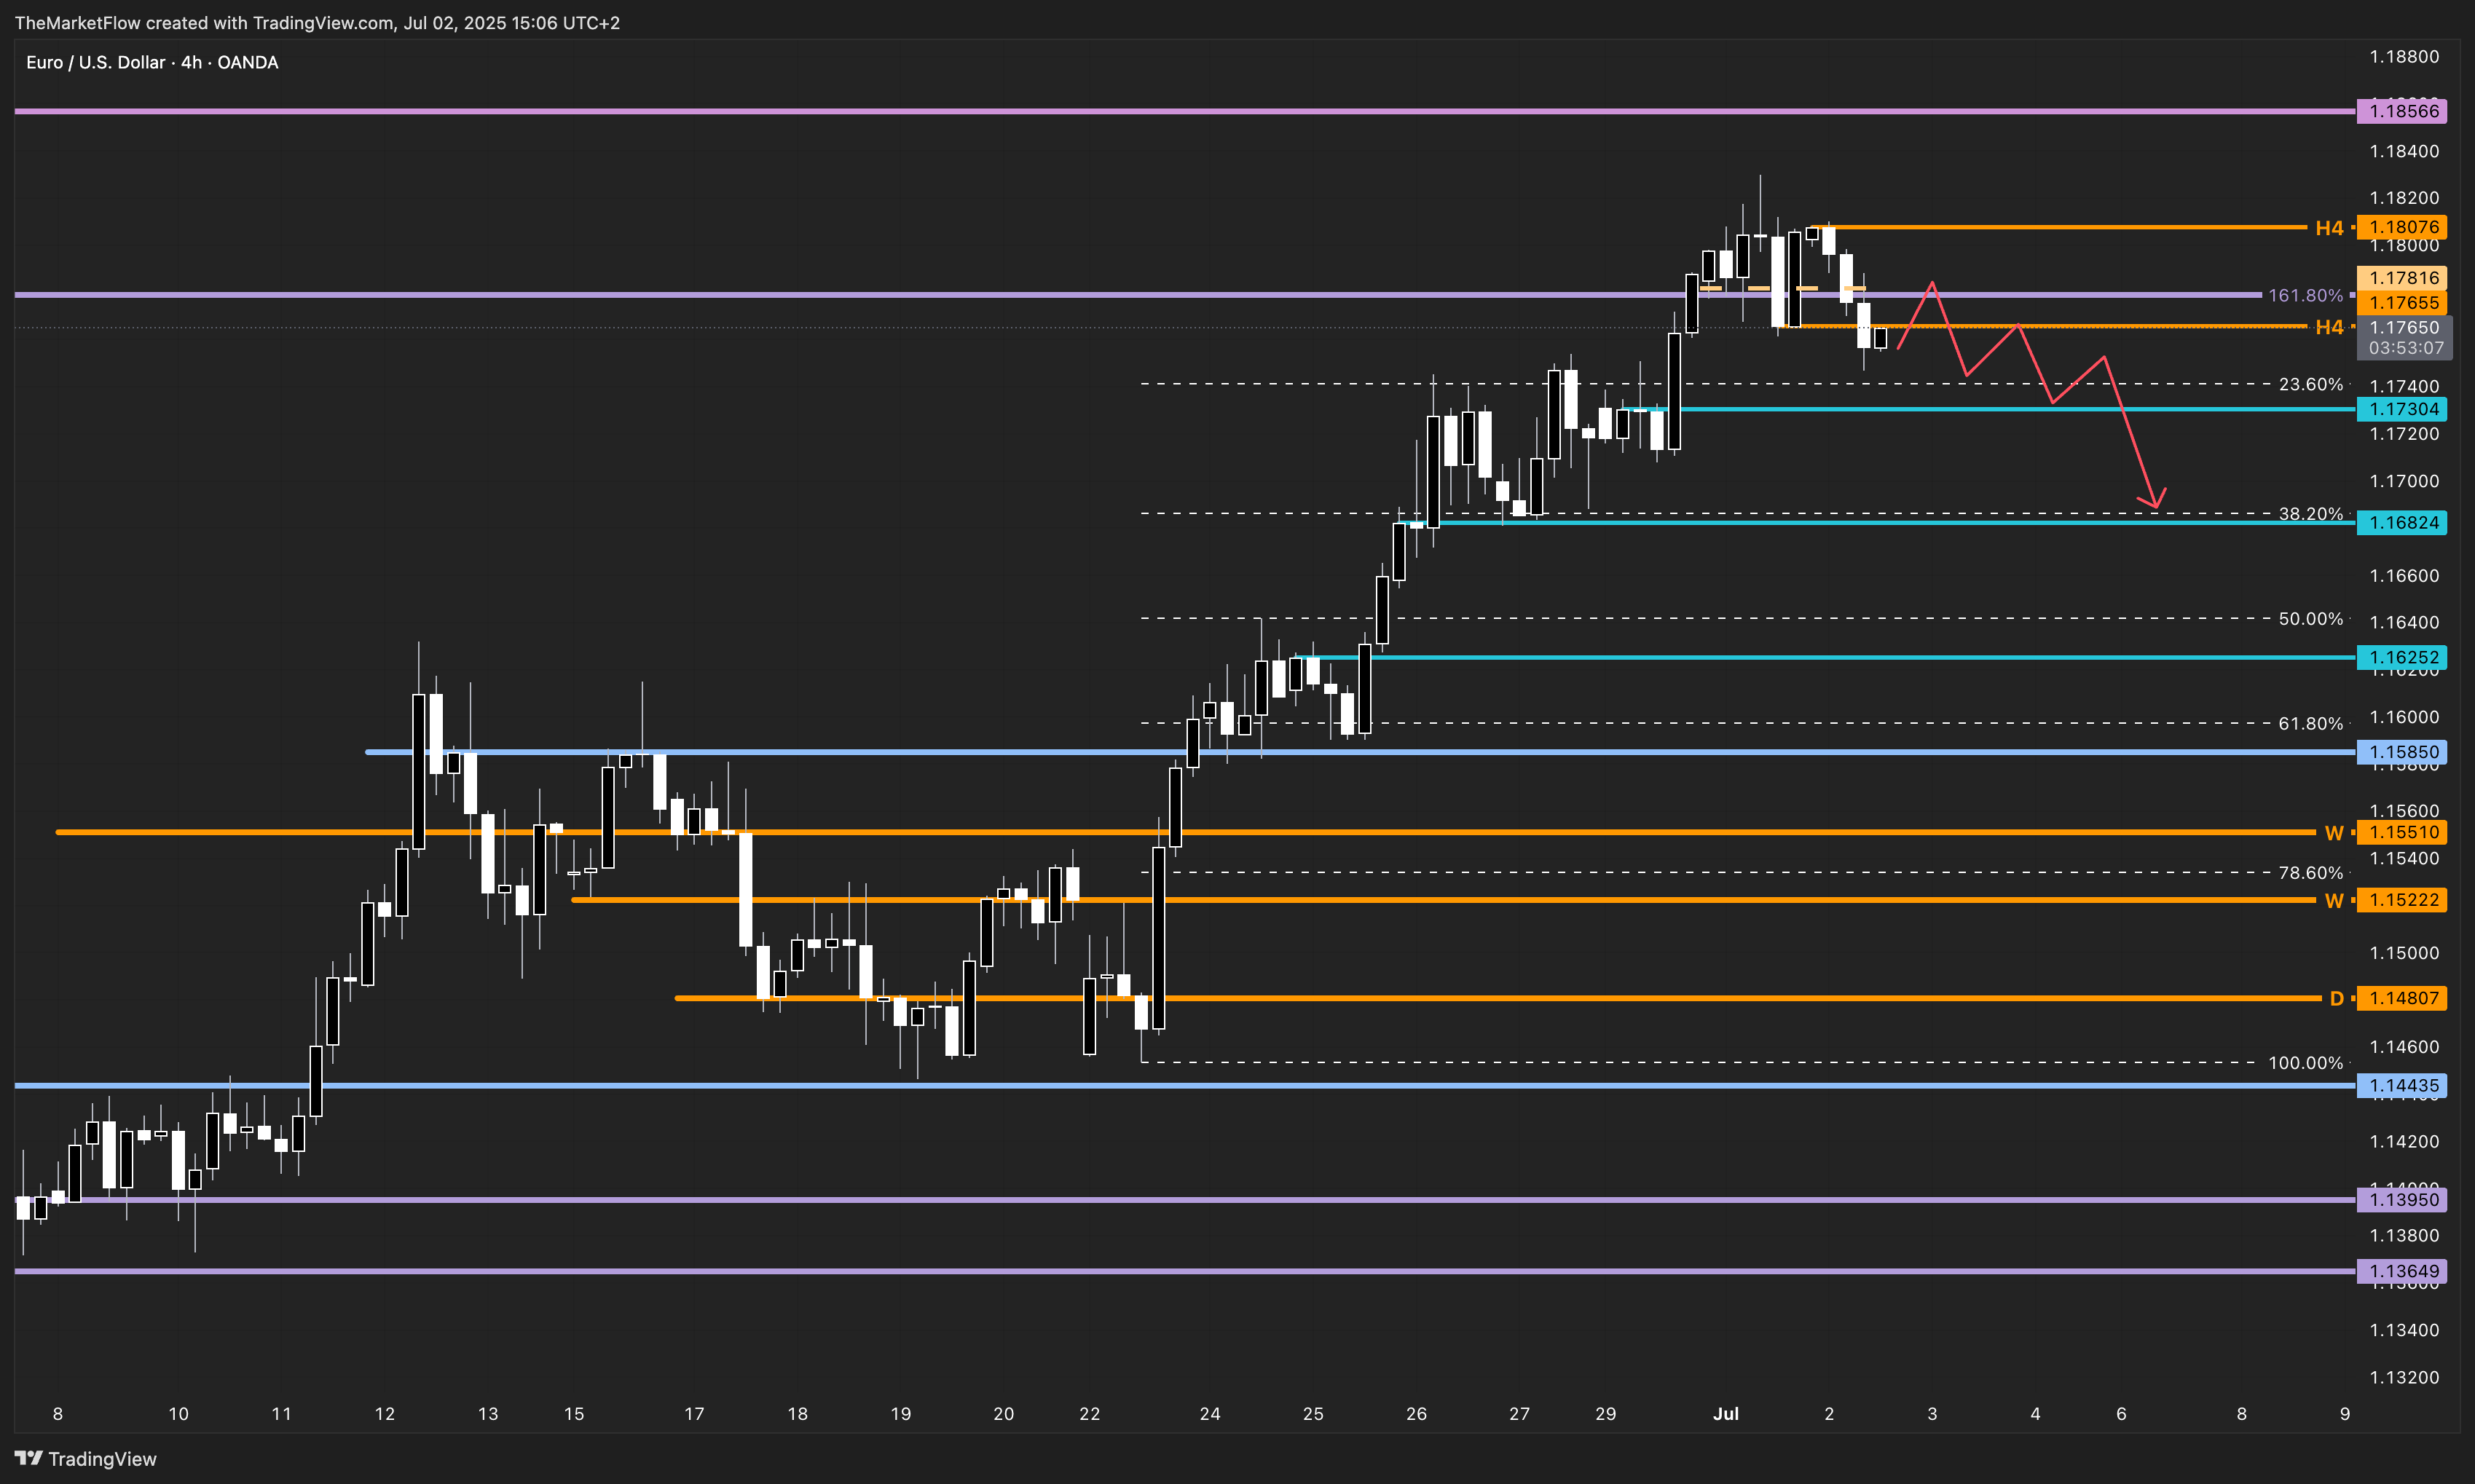
The current move could be classified as a corrective leg targeting lower Fibonacci retracements:
23.60% correction Fibonacci and H4 breakout at 1.17304
38.20% correction Fibonacci and H4 breakout at 1.16824
If price fails to reclaim the broken H4 pivot (1.17655), these retracements become key zones of interest for tactical shorts.
The short trigger path is mapped out via a red zigzag arrow suggesting a breakdown continuation.
Key Levels
Short Trigger: break of any H1/M15 long countertrend, as long as the new H4 pivot at 1.18076 is not broken.
Long Trigger: None active until H4 structure is reclaimed above 1.17655
Validity
The current countertrend setup remains valid below the new H4 pivot at 1.18076. Reclaiming this level could invalidate the short thesis and reintroduce the potential for continuation toward the daily 200% Fibonacci and monthly breakdown.
Summary
EUR/USD’s long trend remains structurally intact on higher timeframes, but the recent H4 break below 1.17655 introduces a countertrend move targeting correction Fibs. Price is likely to probe lower into the 1.17304–1.16824 range unless buyers reclaim the broken structure. This is a tactical correction within a bullish macro trend, not a reversal unless confirmed by deeper structure breaks.
What’s your take on the H4 breakdown—short-term retracement or start of deeper correction?