
EUR/HUF Setup: Bullish Momentum Rebuilding from Weekly Break
Daily breakout reclaims minor trend control, eyes on 407.425 as trigger for next impulsive wave toward Fibonacci targets.

Market Overview
EUR/HUF has entered a pivotal technical juncture across the higher timeframes. Following a correction from multi-month highs, the pair is attempting to rebuild a bullish structure, supported by a confluence of trendlines, key Fibonacci extensions, and reclaimed structural levels.
Monthly Trend
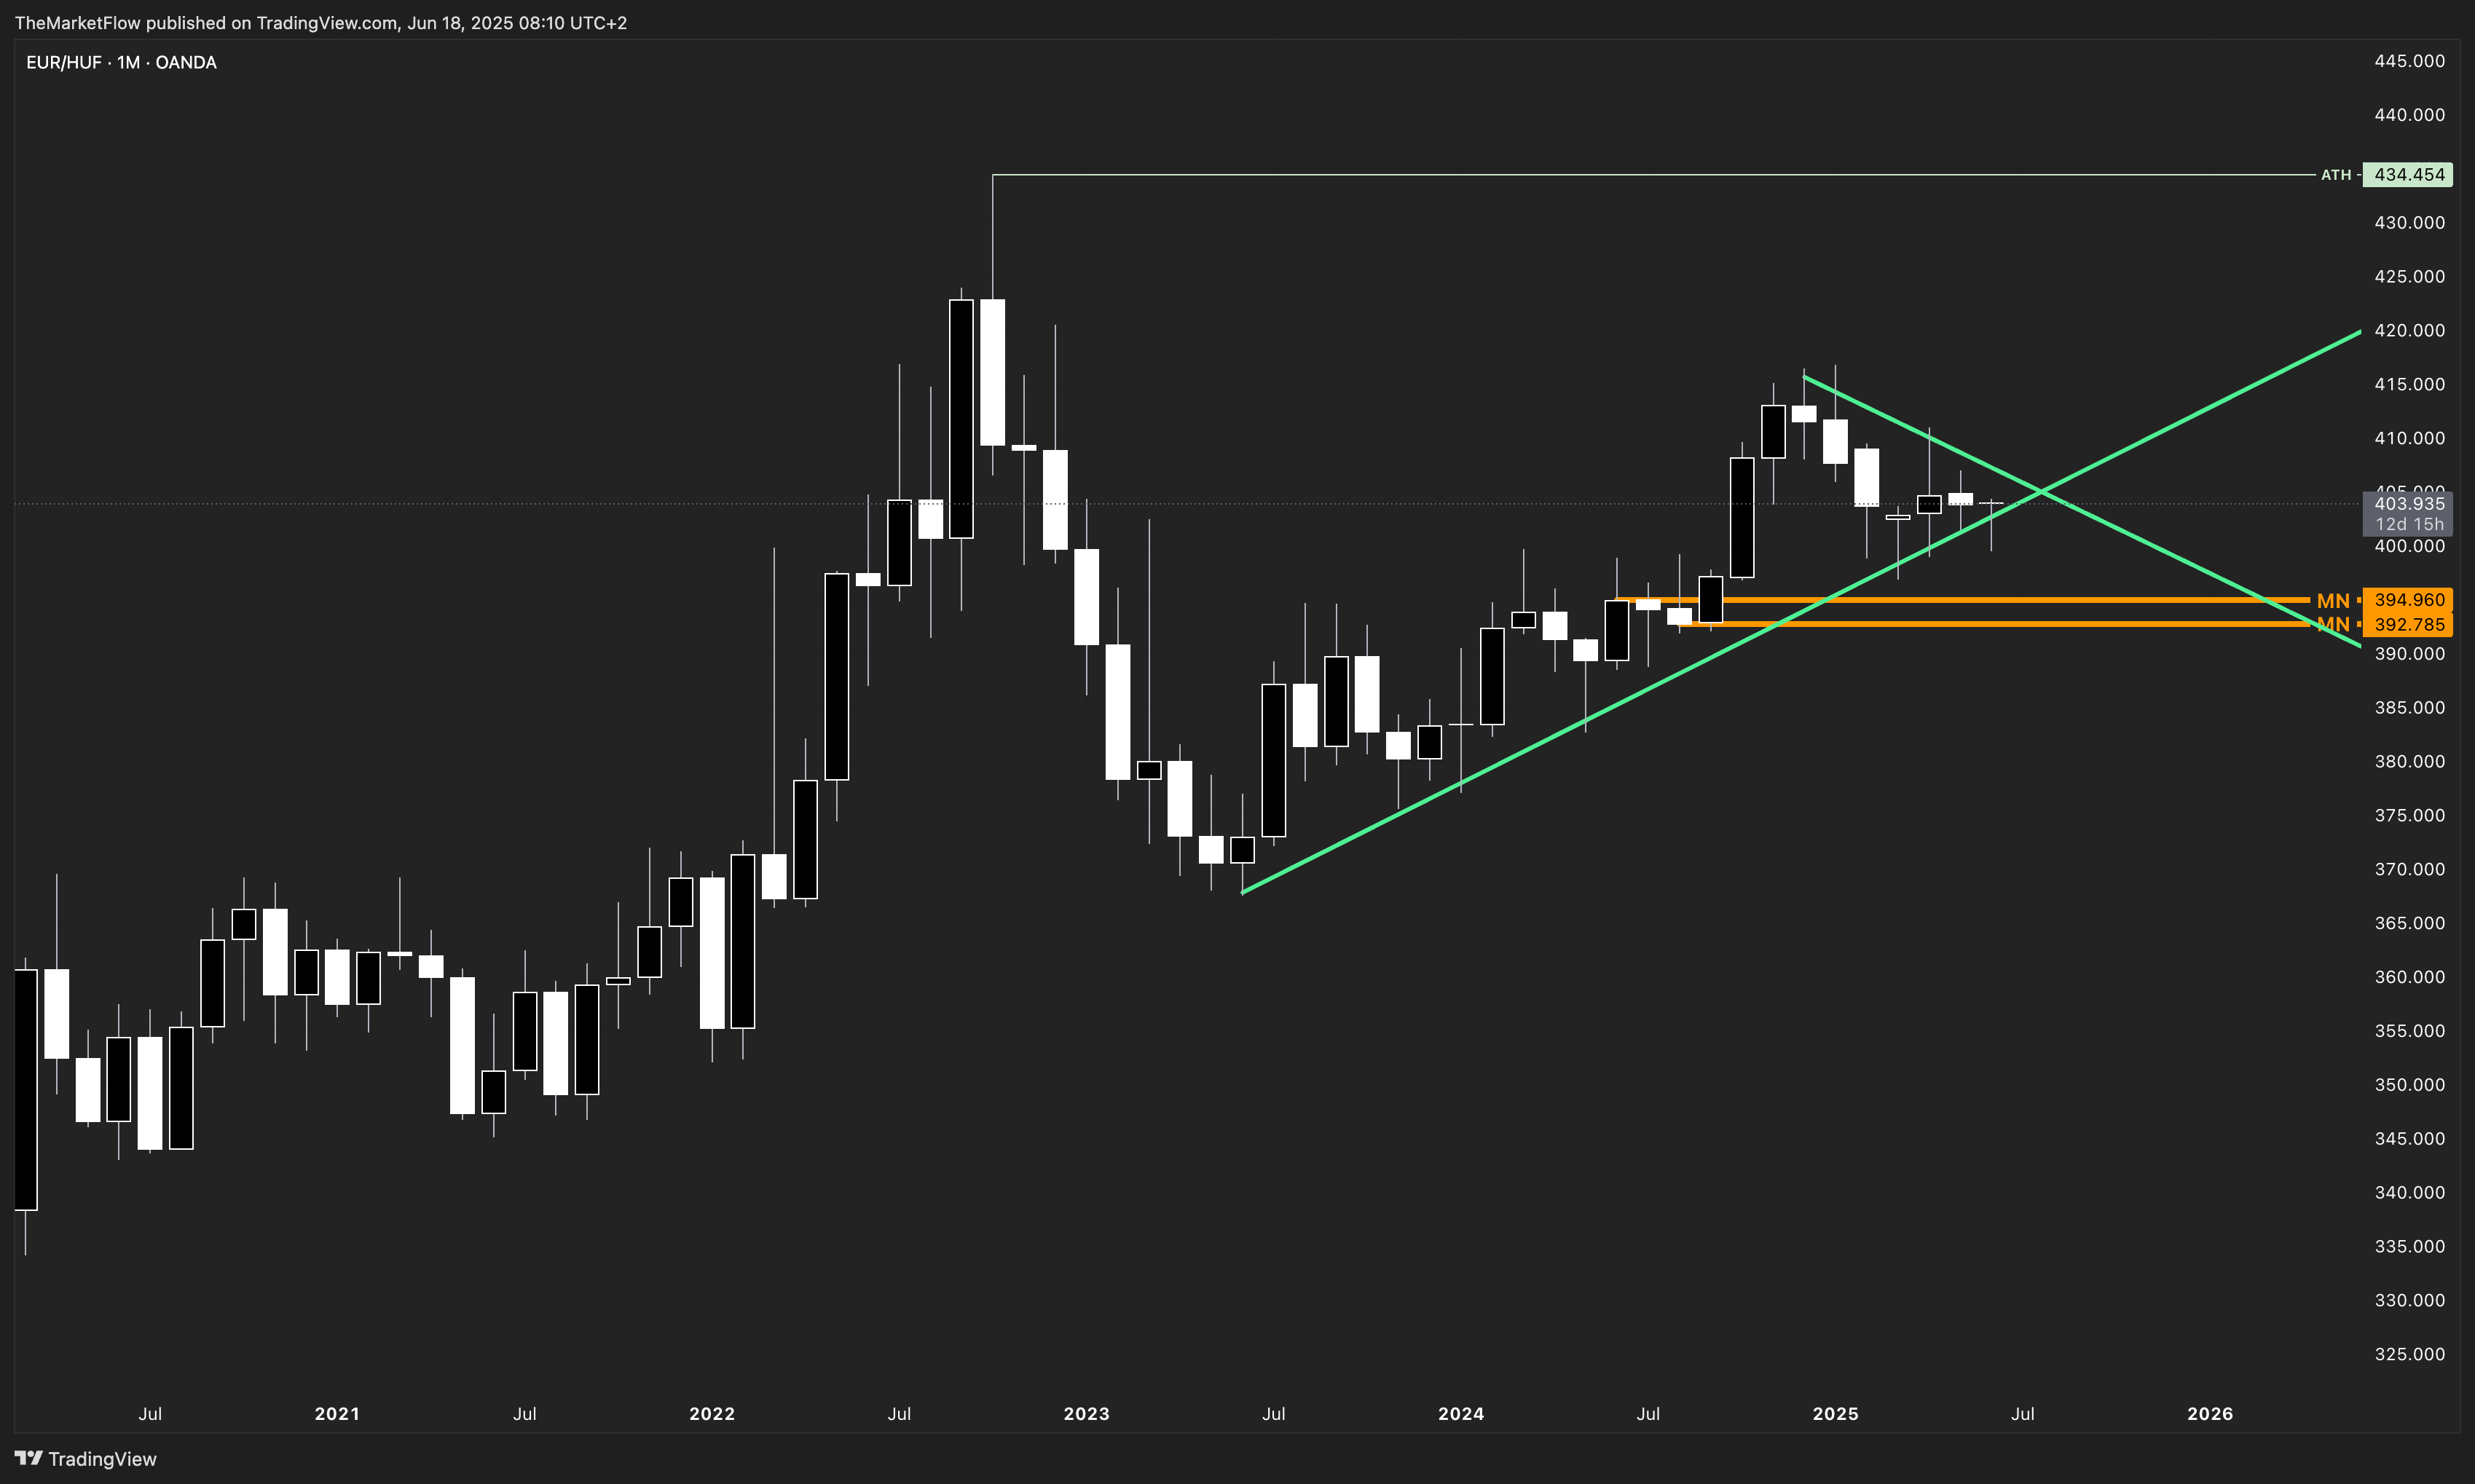
The monthly chart shows a well-established long-term uptrend, supported by a strong ascending trendline dating back to 2023. Despite a corrective pullback from the all-time high (ATH) at 434.454, the structure remains intact above the key monthly levels at 394.960 and 392.785. These form the long-term pivot zone, which has held firm during the recent retracement.
Weekly Structure
On the weekly chart, a short-term countertrend has broken to the upside. The first wave of the new weekly leg has tested the weekly breakdown level at 410.582, but failed to close above it. This level marks a critical resistance within the broader bullish continuation pattern.

The green ascending trendline from mid-2023 remains structurally intact, with recent price action bouncing from this dynamic support area—suggesting renewed bullish intent.
Daily Chart
The daily chart confirms a break of the short-term countertrend structure with a fresh impulsive candle closing above the descending green trendline. This development turns the daily structure into a minor bull trend, shifting focus to higher levels.
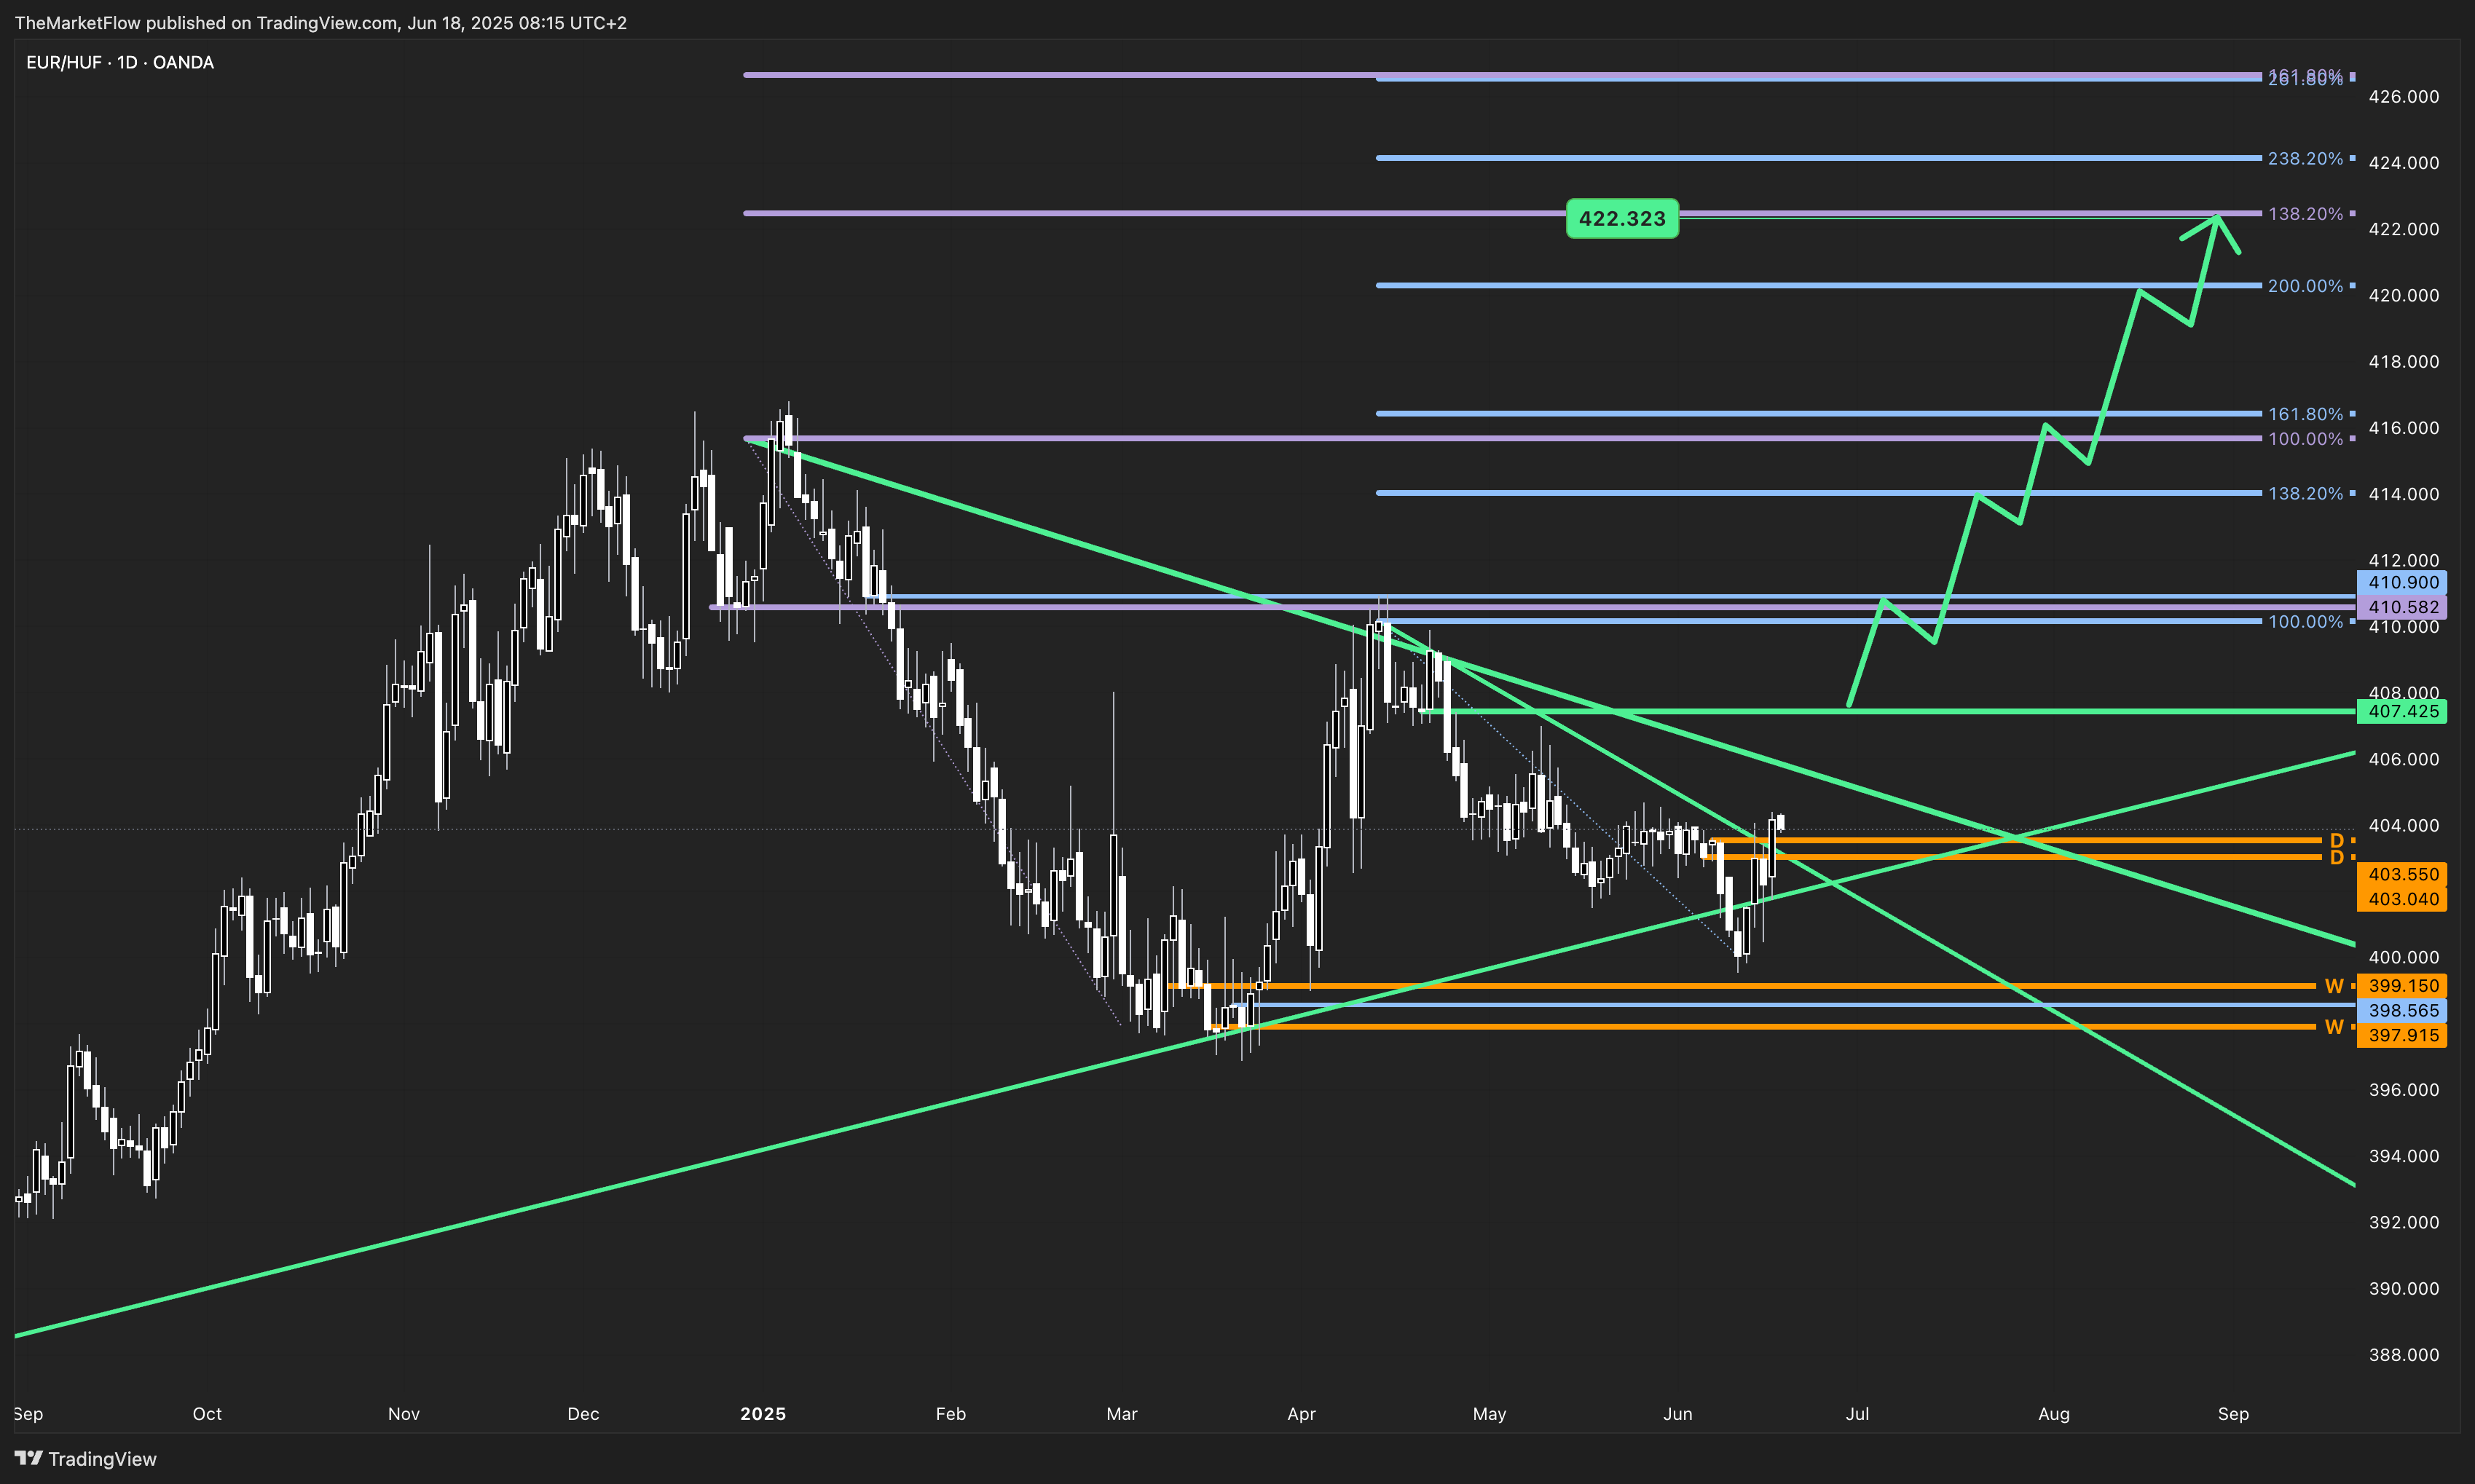
Price is currently consolidating below the 407.425 breakdown level, the highest clean breakdown on this timeframe. This is now a key trigger level for initiating the expansion phase of primary long trend.
Trigger Levels
Bullish Trigger: Clean break and close above 407.425
Support Zone: 403.040 – 399.150 (multi-timeframe demand)
Invalidation: Daily close below 397.915 suggests deeper retracement risk toward monthly pivot at 392.785
Target Zones
If 407.425 is breached, the upside Fibonacci targets are:
410.582 (100% retrace of previous drop)
414.000-416.500 (daily target Fibonacci zone)
422.323 (weekly target Fibonacci 138.2%)
426.000+ (extension zone aligning with the 261.8% Fibonacci on daily)
Summary
EUR/HUF is transitioning back into a bullish structure across all timeframes. The recent daily breakout aligns with a broader weekly recovery phase, with 407.425 as the key breakout zone. Holding above the short-term support cluster opens the door for a momentum push into the high 410s and beyond.
Actionable Insight
Monitor price action at 407.425 closely. A clean daily close above this level sets the stage for a multi-week bullish continuation in the expansion phase. Traders should look for confirmation via sustained momentum candles and intraday retests of breakout zones for optimal entries.
Stay subscribed for updates as this setup unfolds—momentum is building, and timing will be critical.