
EQT | Weekly Expansion Trigger Confirmed Above EXP Zone
Structural breakout confirmed on weekly close, initiating expansion toward the 138.2% Fibonacci projection.

The Market Flow | November 7, 2025
Company Overview
EQT Corporation is the largest natural gas producer in the United States, operating primarily in the Appalachian Basin. The company’s business model centers on exploration, production, and sale of natural gas and natural gas liquids, leveraging scale efficiencies and operational discipline to optimize margins.
EQT fits the cyclical category — its earnings and share performance are closely tied to commodity price cycles, with profitability depending on production efficiency and market pricing dynamics.
Technical Overview
Monthly
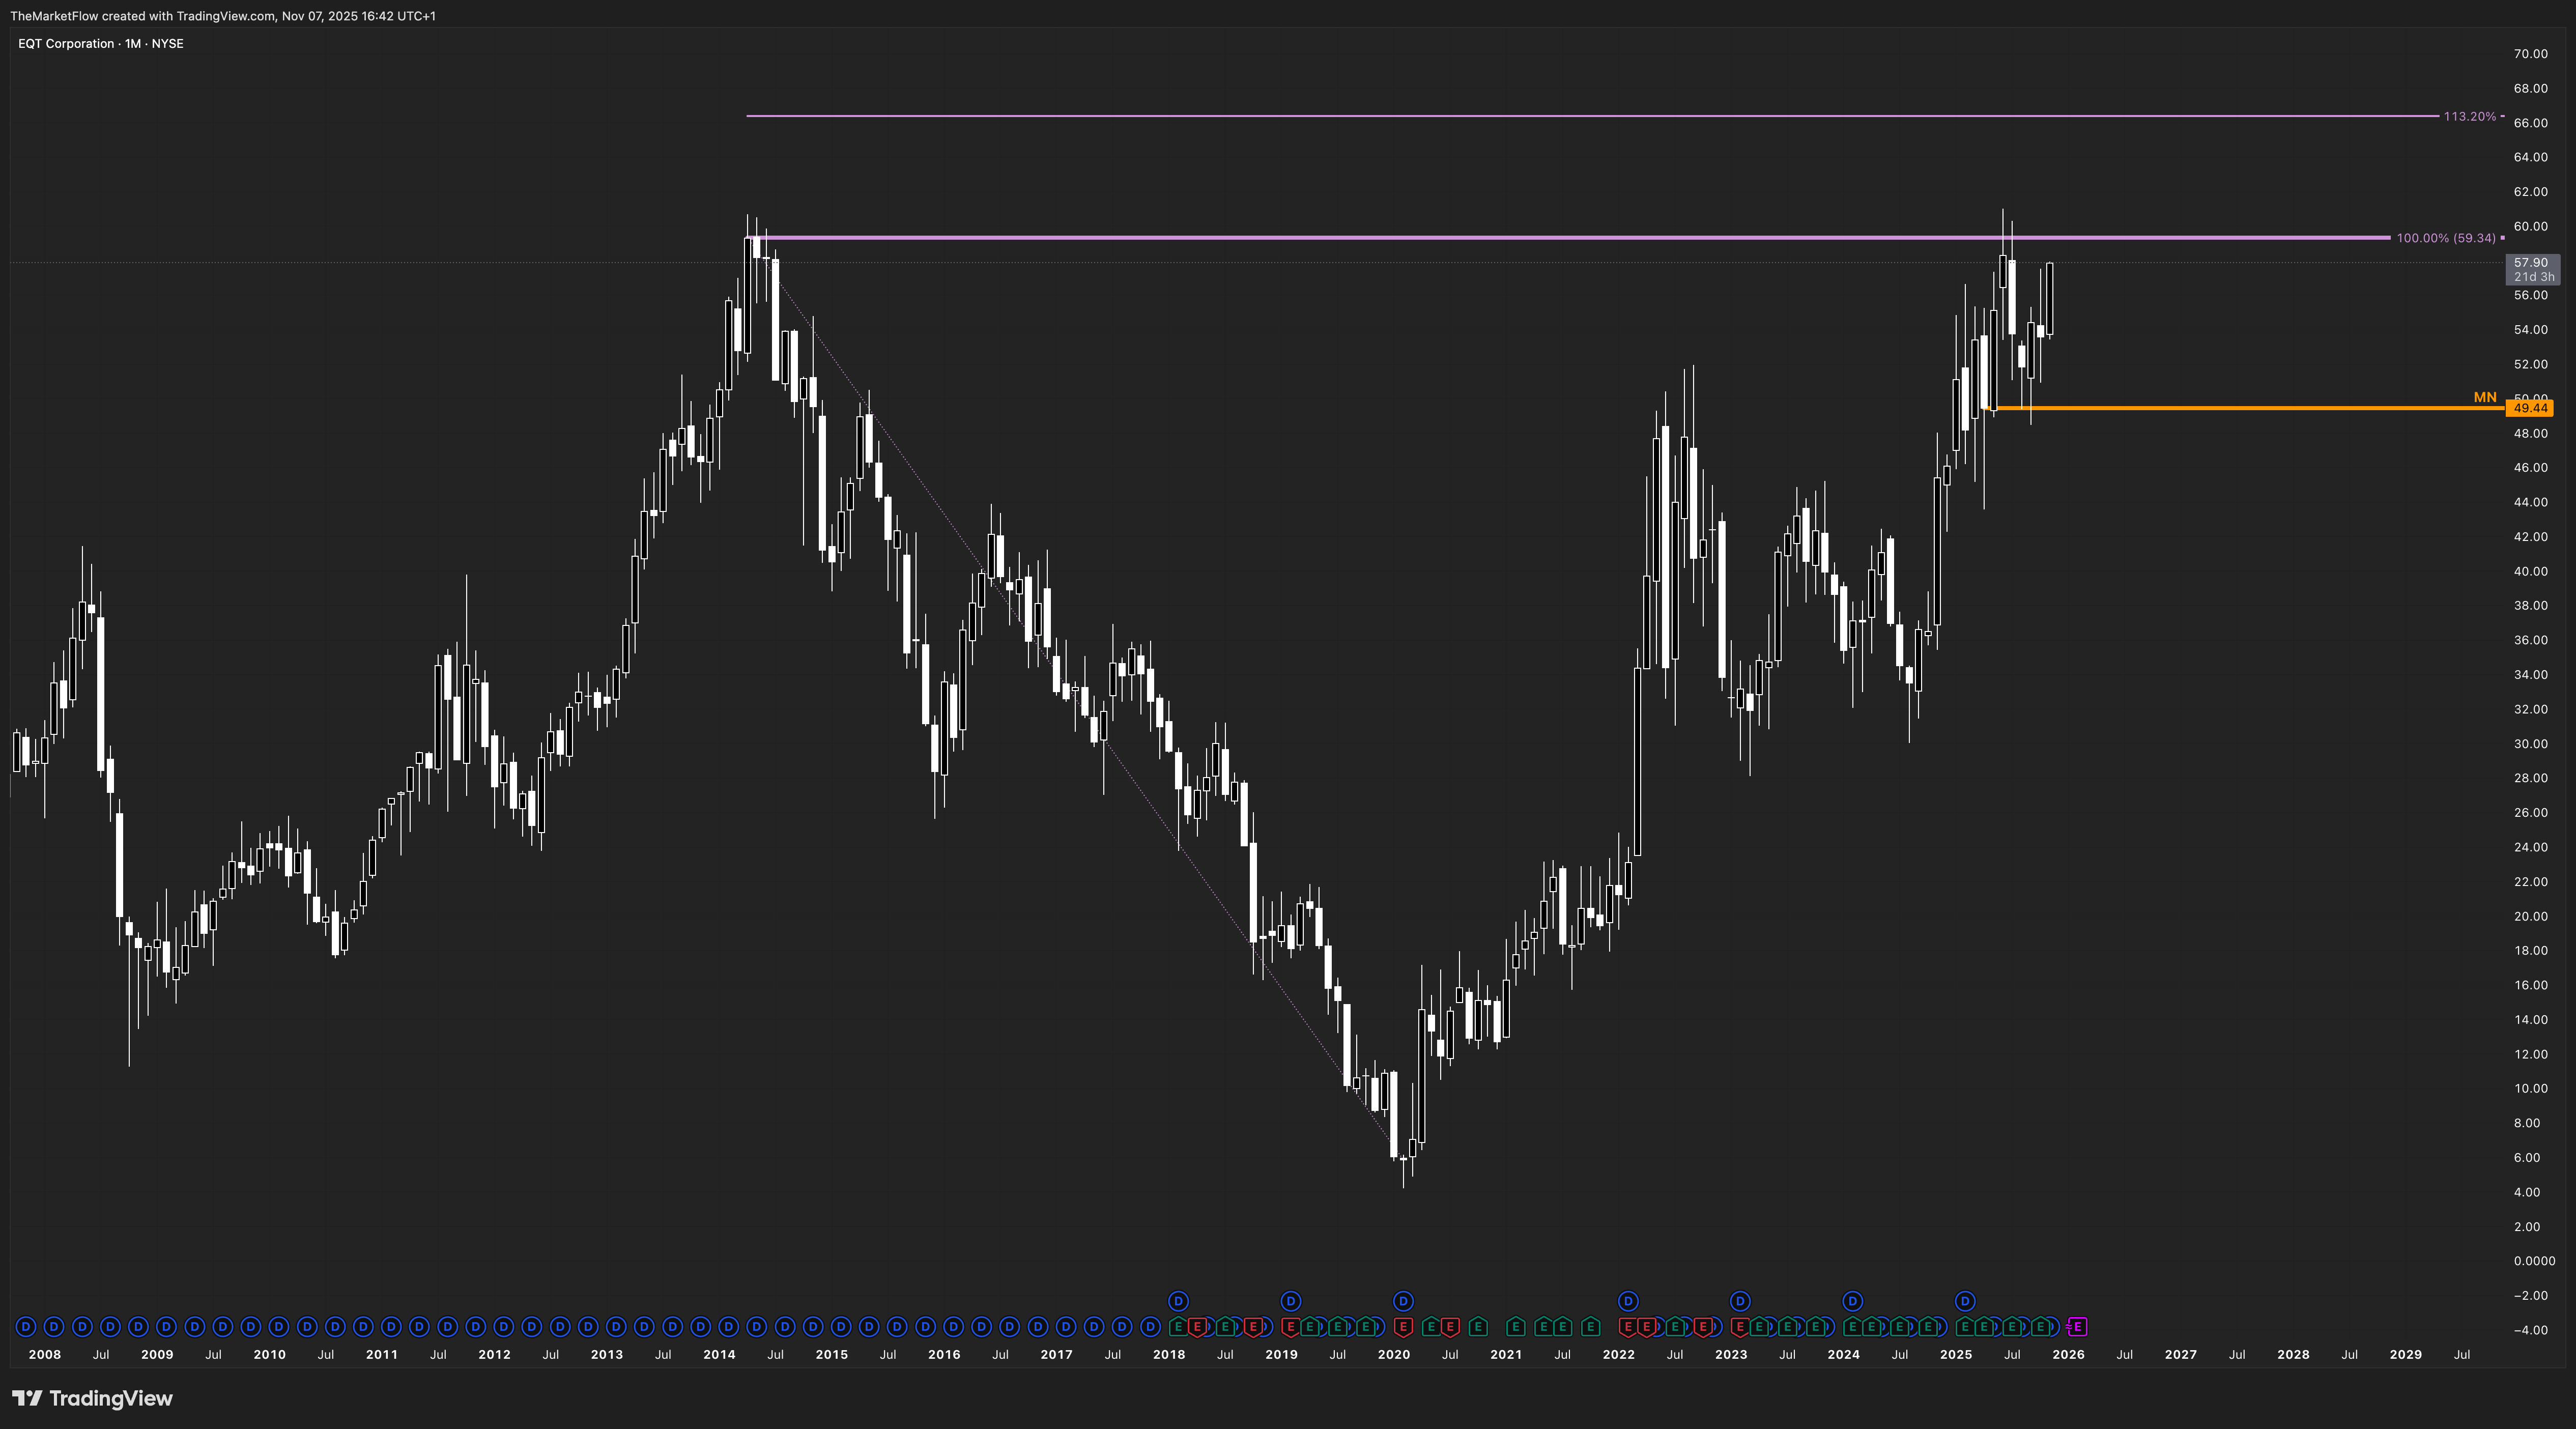
The monthly structure remains firmly bullish, sustaining price action above the key pivot at 49.44. The 100% Fibonacci projection at 59.34 has been achieved, confirming continuation within the higher-timeframe expansion phase. Momentum persists as the market maintains higher lows and expands structurally toward the next measured extension.
Weekly
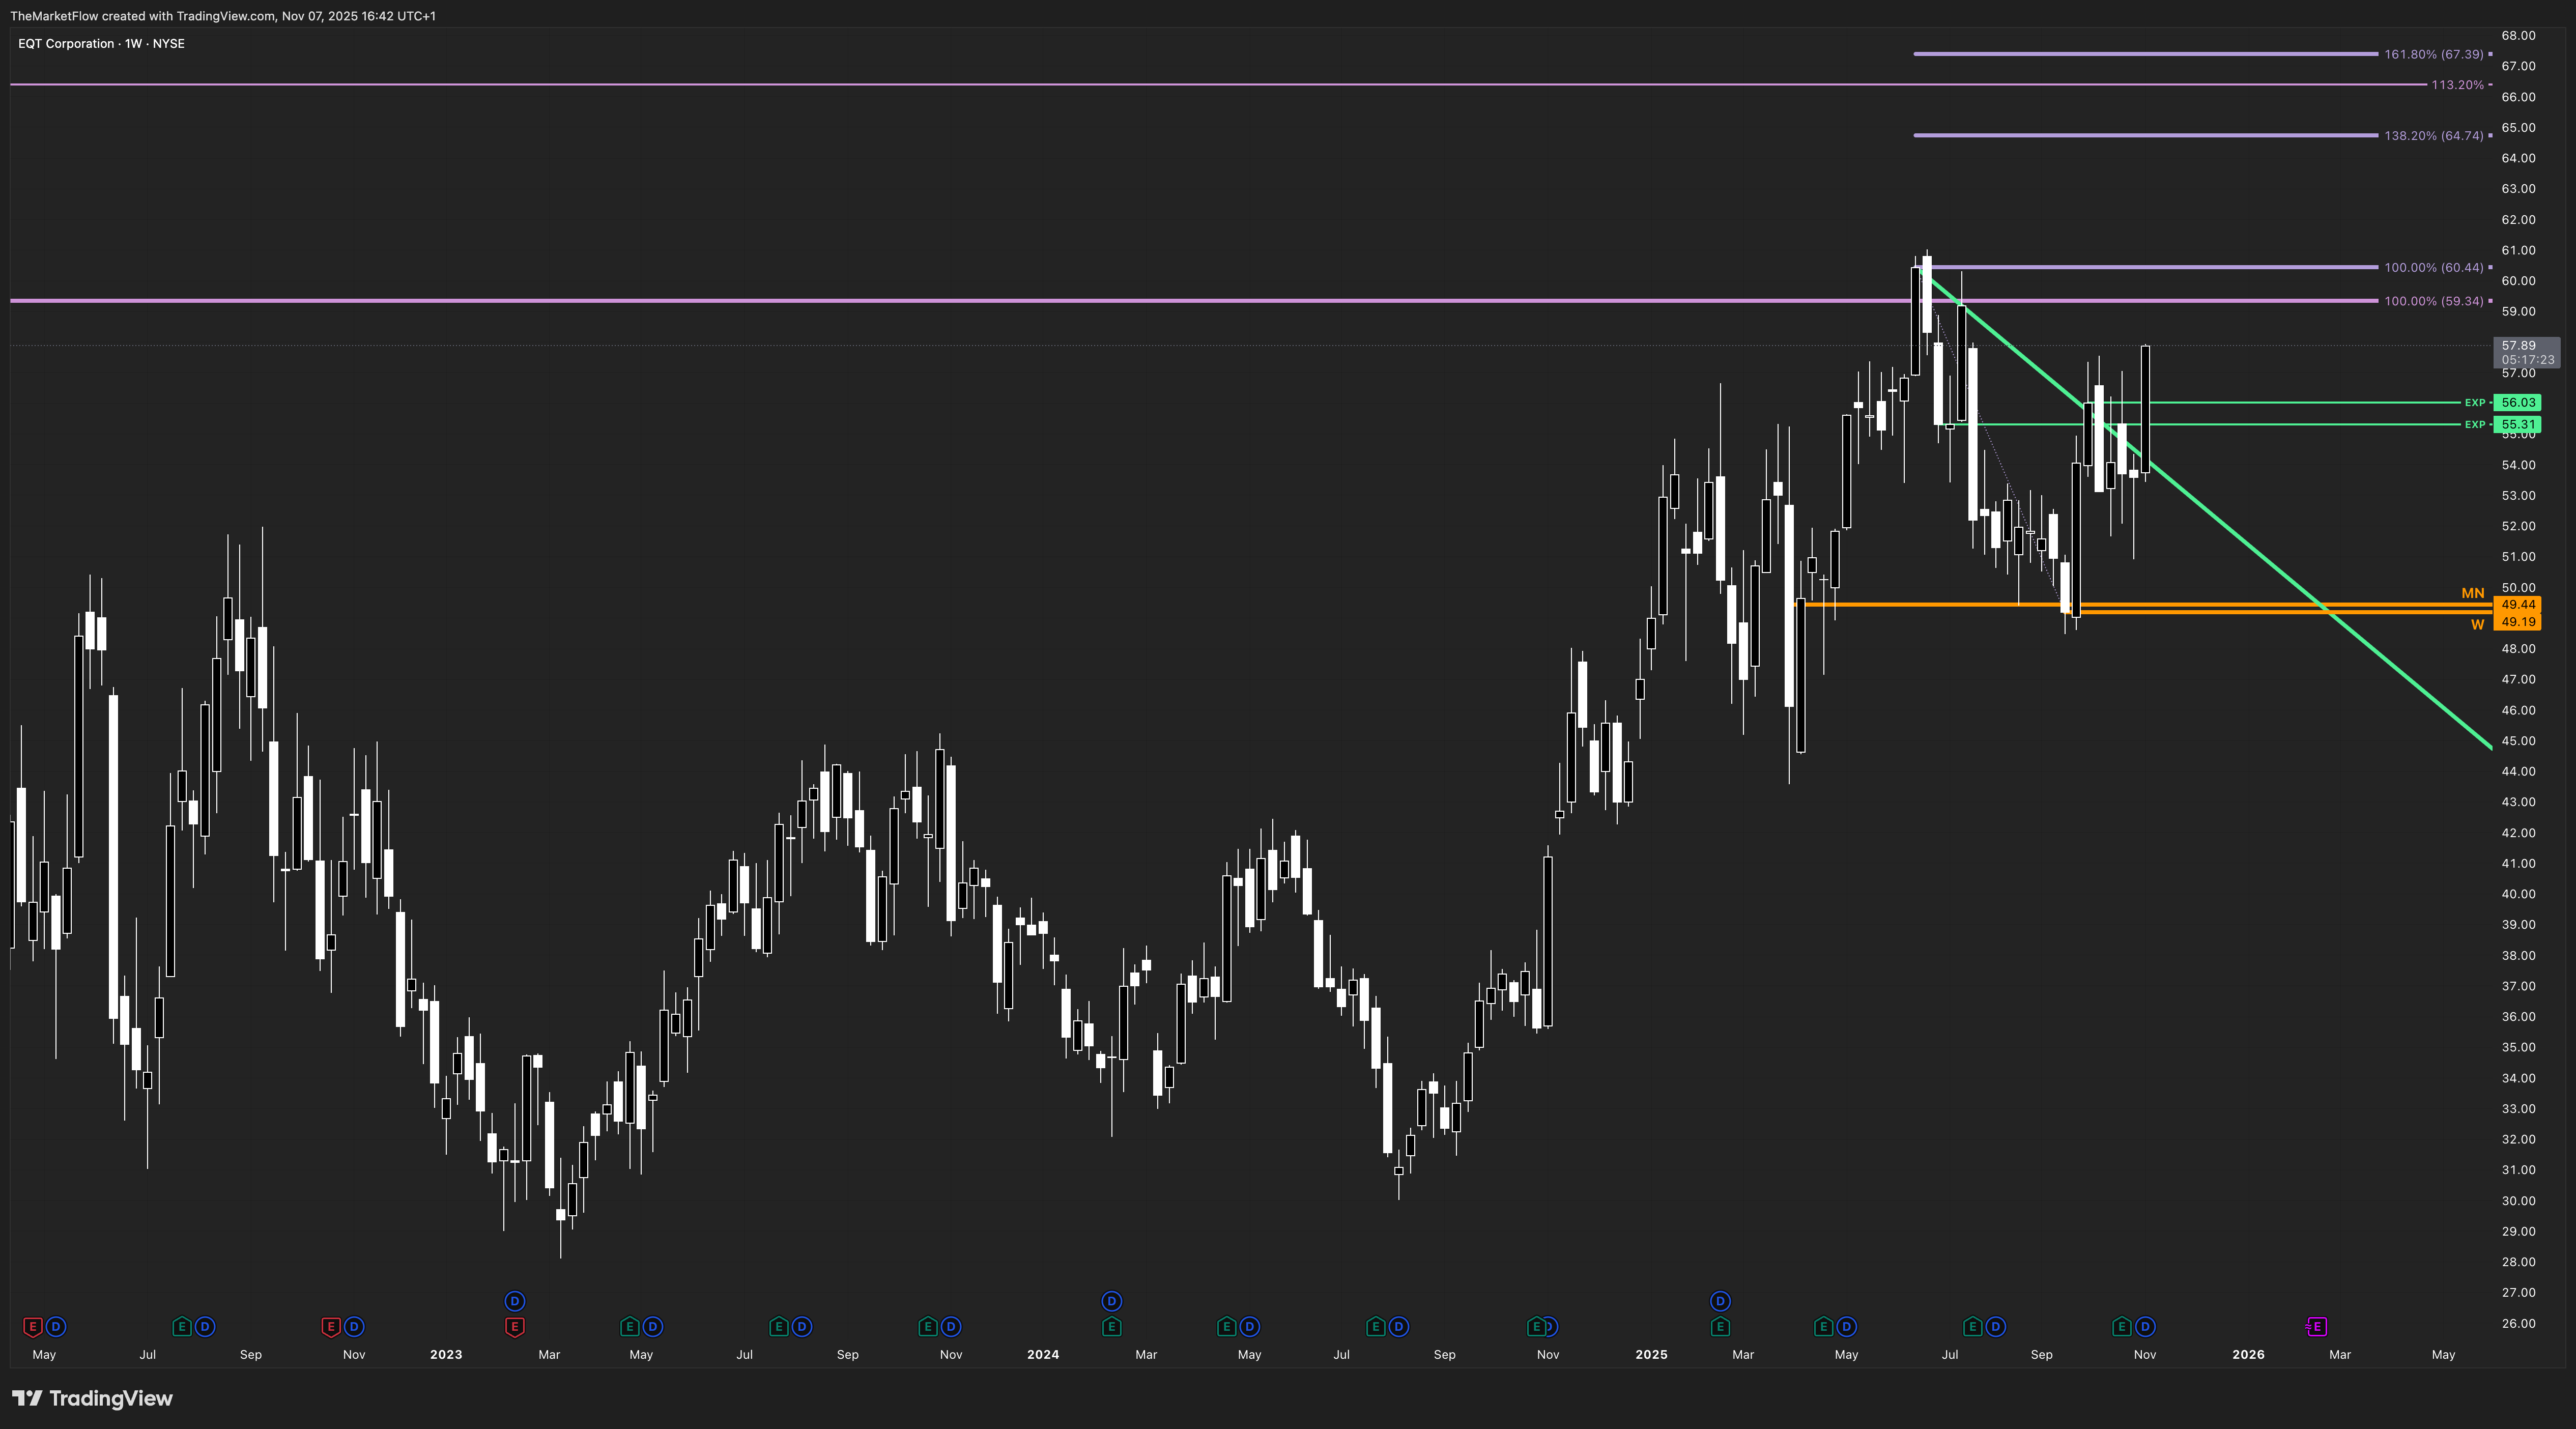
A confirmed structural trigger occurred with a decisive weekly close above the prior EXP zone (55.31–56.05). This breakout marks the official start of the weekly expansion phase, aligned with the dominant monthly uptrend. Price has invalidated the previous countertrend structure and reactivated the bullish leg, opening the path toward the weekly Fibonacci 138.2% projection at 64.74.
The weekly pivot at 49.19 now defines structural invalidation — a confirmed close below this level would negate the active expansion sequence.
Daily
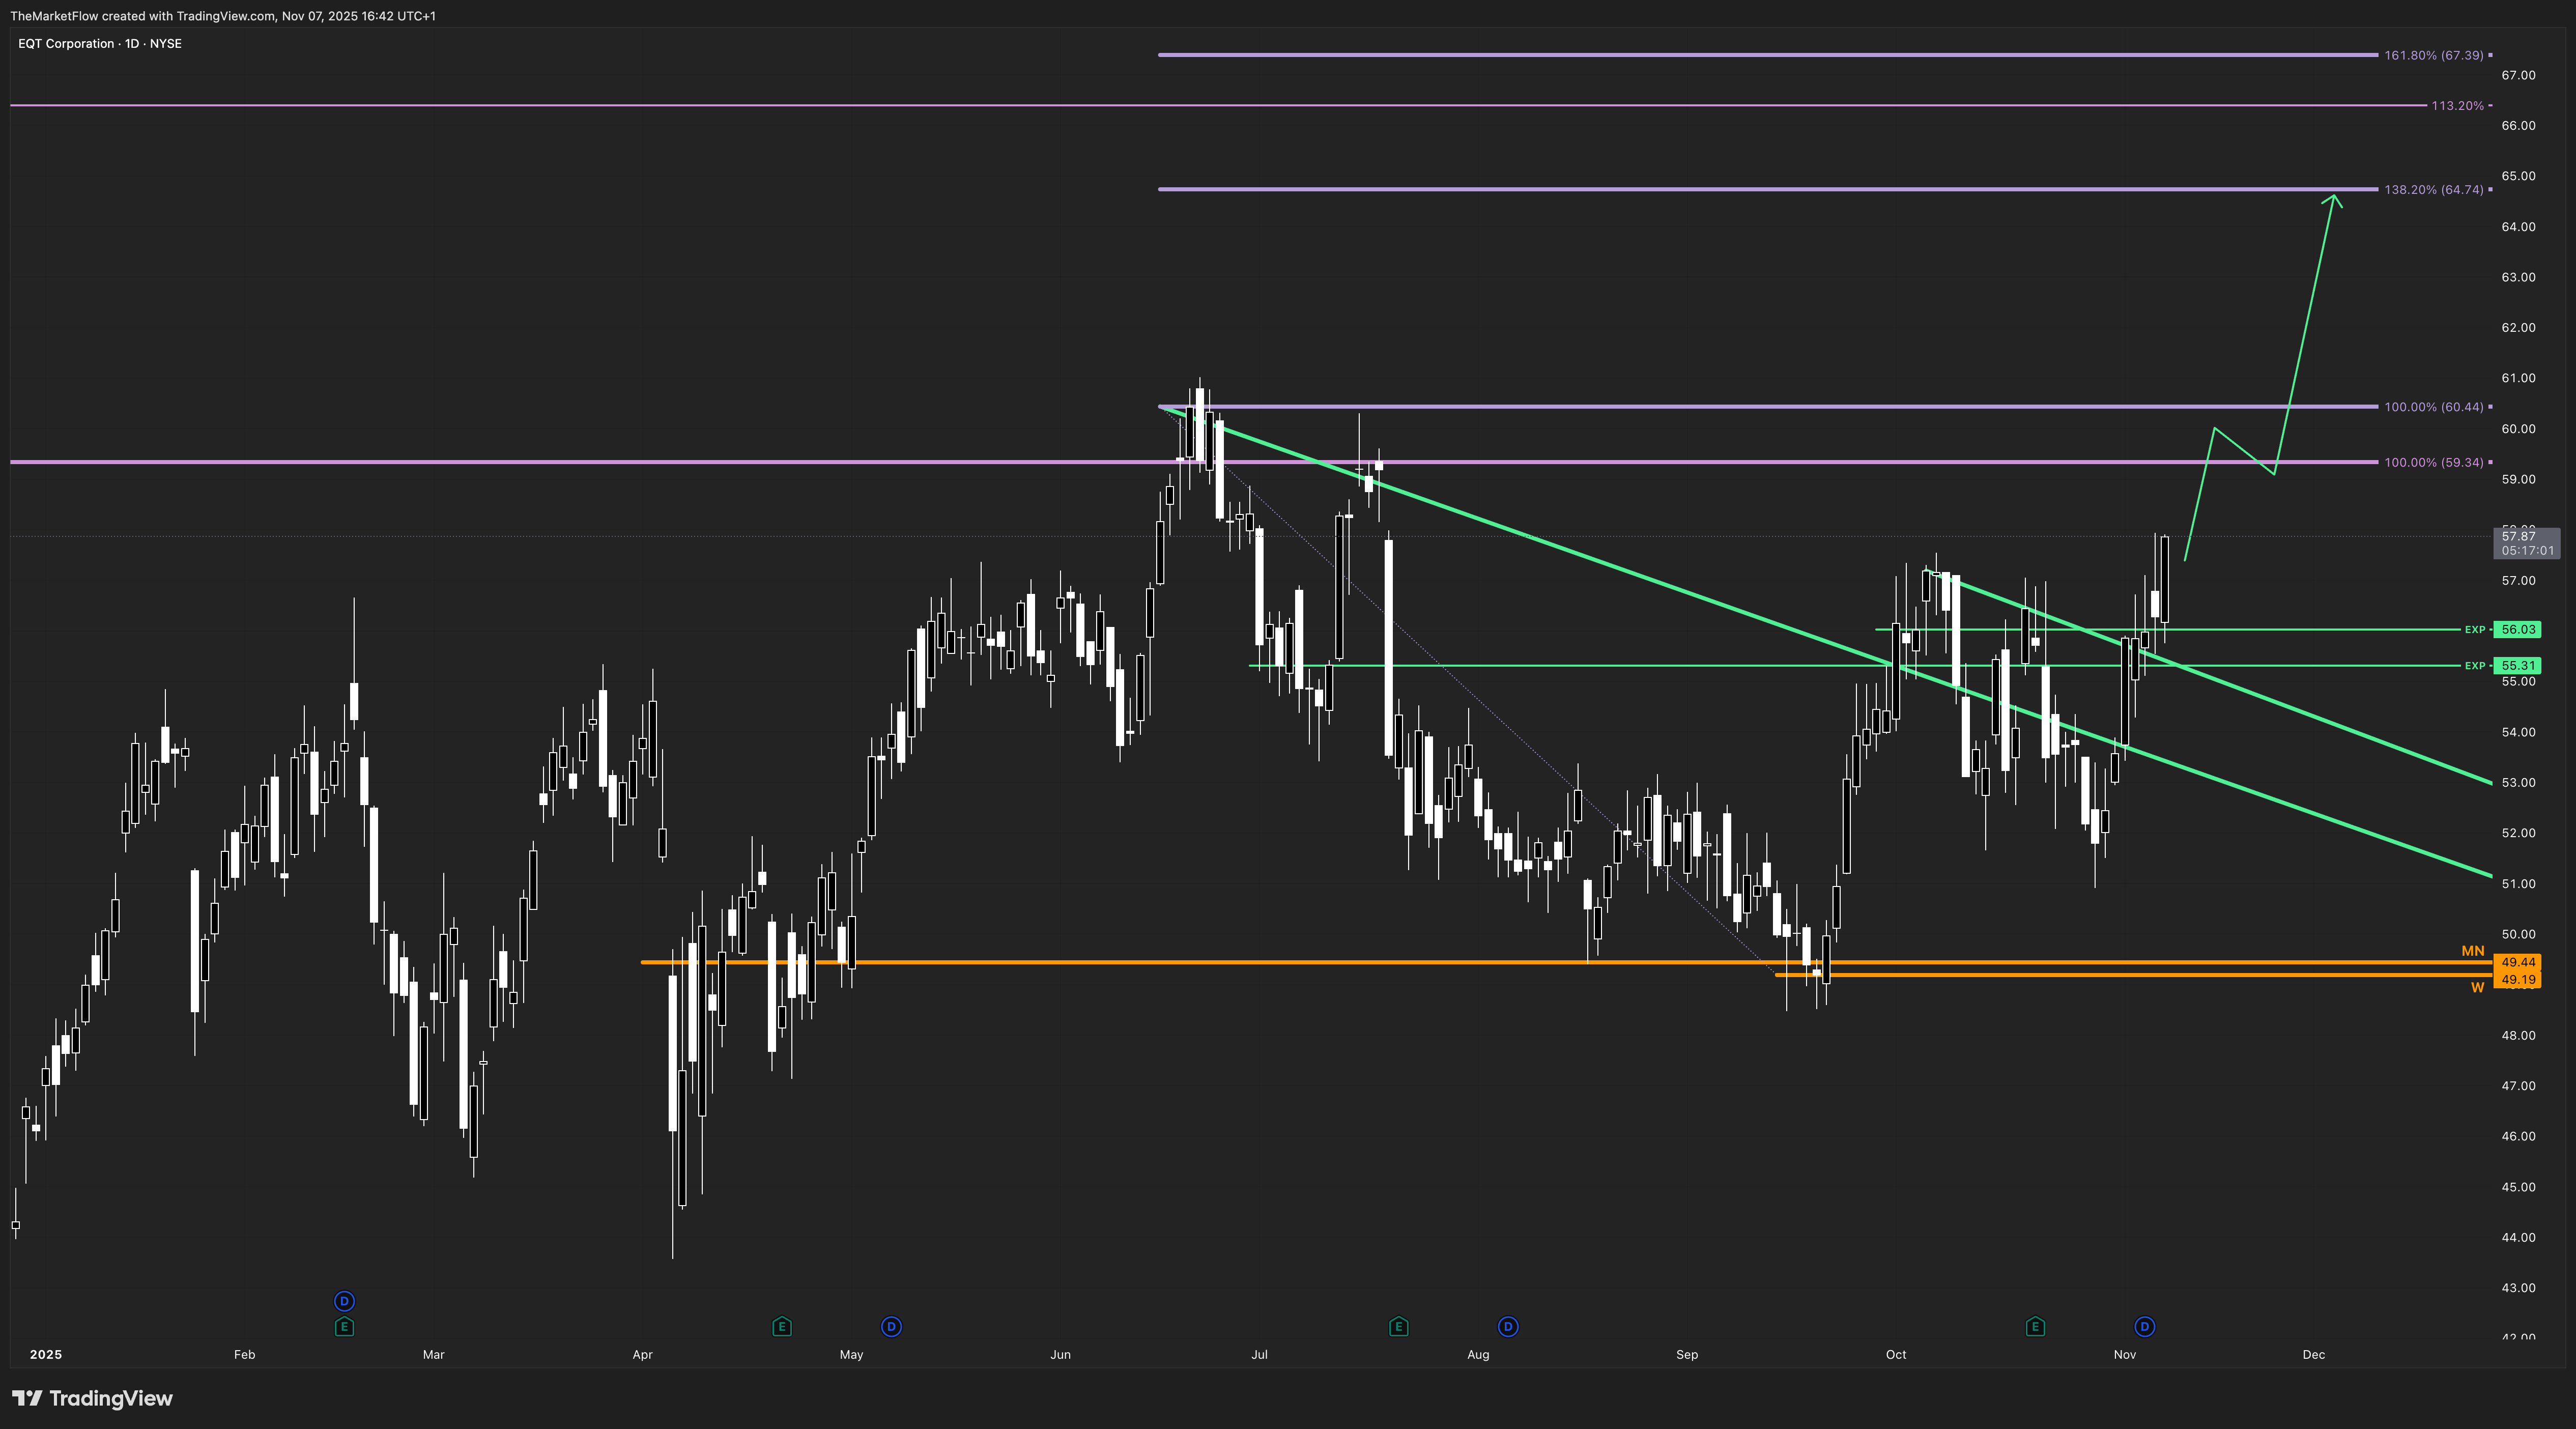
Daily structure supports the expansion with a clean sequence of higher lows and confirmed break above the descending daily trigger. The 100% Fibonacci zone around 60.44 represents the next key resistance alignment, where initial profit-taking may occur before continuation toward the 138.2% target. The structure remains expansionary as long as daily closes stay above the revalidated trigger zone near 56.
H4
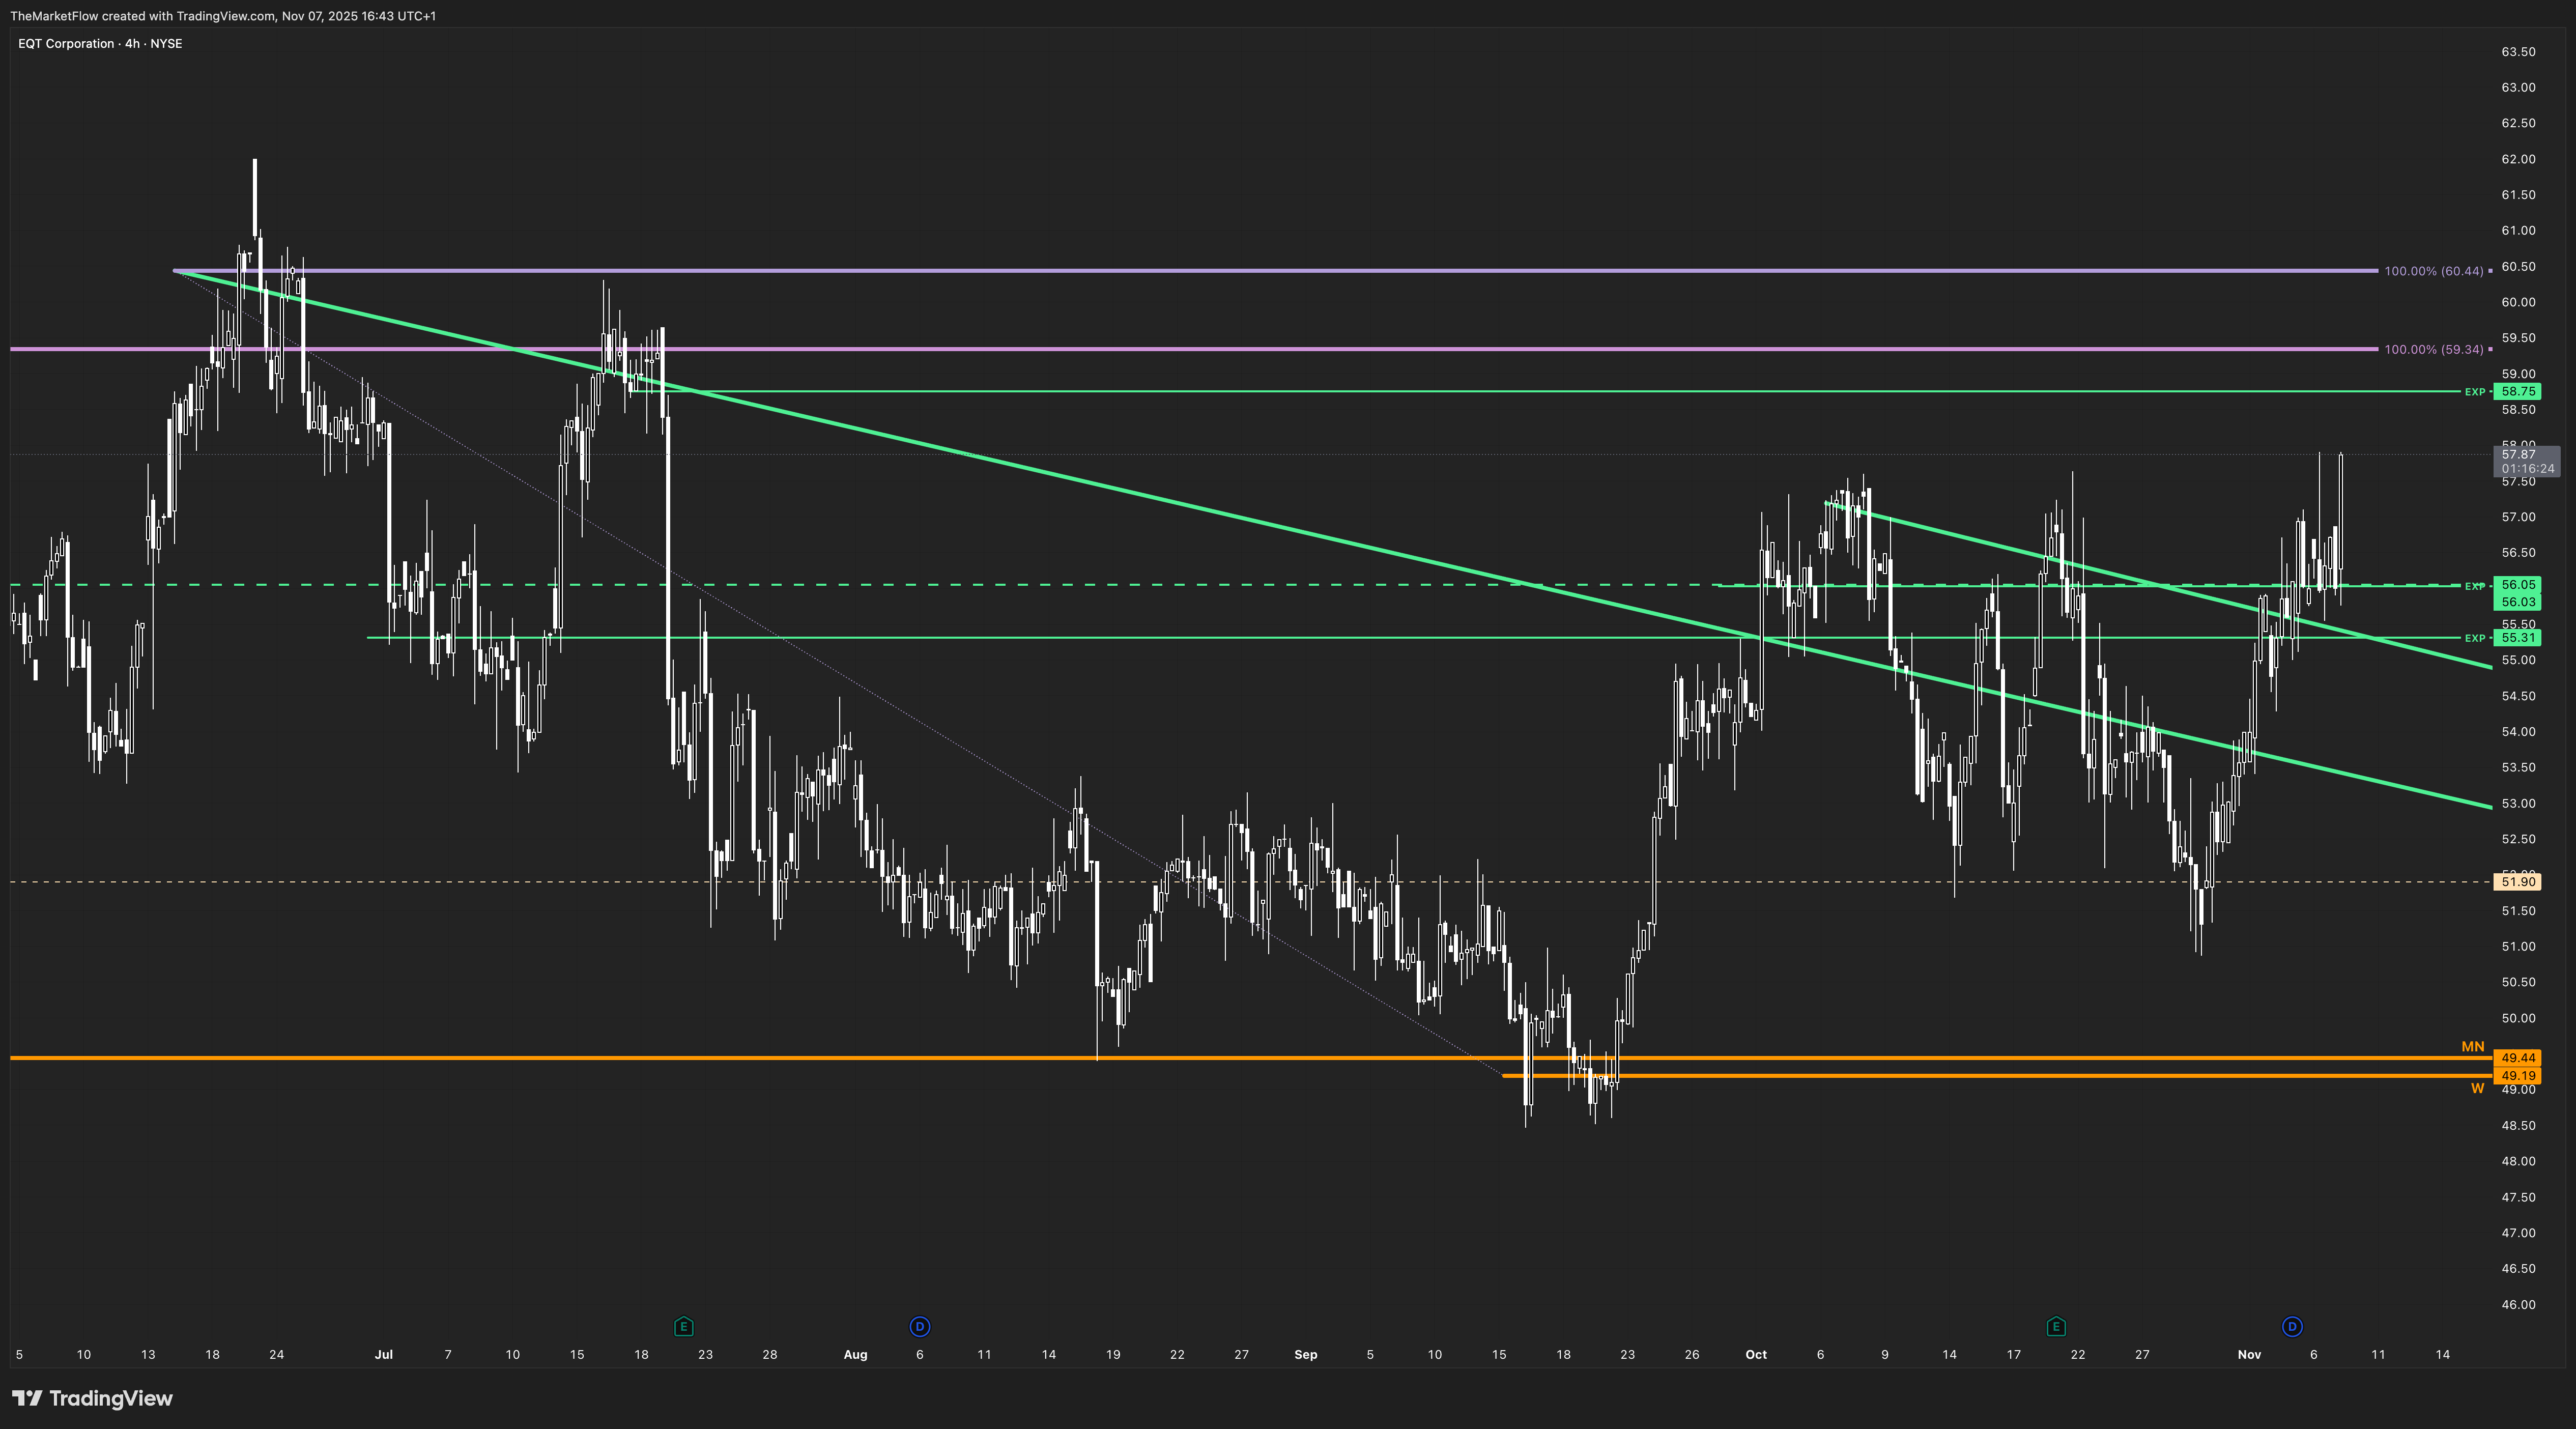
The H4 structure remains expansionary, sustaining momentum after confirming above 56.05. Wave rhythm is consistent with the higher-timeframe expansion, showing multiple successful retests of the prior trigger. However, there is a nearby H4 EXP level at 58.75 (clean breakdown) that may act as temporary resistance — positions should be managed around this zone. A clean break and hold above it would resume flow toward 60.44, completing full alignment with the daily and weekly expansion path.
Trade Structure & Levels
Bias: Long above 49.19 (W pivot)
Phase: Expansion
Trigger: Weekly close above EXP zone 55.31–56.05
Invalidation: Weekly close below 49.19
Path → 59.34 → 60.44 → 64.74
ATR(14D): 1.92
Volume(20D): 4.6M
Risk & Event Context
Natural gas price fluctuations remain the dominant macro driver. Seasonal demand, winter storage data, and upcoming energy-sector earnings could introduce short-term volatility, but structural bias remains aligned with the bullish expansion phase as long as the weekly pivot holds.
Conclusion
EQT has confirmed a weekly expansion trigger with a decisive close above the prior EXP zone. The multi-timeframe alignment between weekly and monthly structures supports a continued bullish path toward 64.74, with 49.19 serving as the structural invalidation threshold. The setup reflects a clear continuation phase within The Market Flow framework.
This publication is provided for informational and educational purposes only and does not constitute investment advice, a solicitation, or a recommendation to buy or sell any security, derivative, or financial instrument. The analysis and opinions expressed reflect the author’s views at the time of writing and are subject to change without notice.
All information is derived from publicly available sources believed to be reliable, but accuracy and completeness are not guaranteed. Past performance is not indicative of future results, and no representation or warranty is made regarding future price behavior or outcomes.
Readers are solely responsible for their own investment decisions and should consult a qualified financial advisor before acting on any information contained herein.
The author and/or affiliates may hold, trade, or have a financial interest in the securities or instruments mentioned in this publication. Neither the author nor any associated party accepts liability for any direct or consequential loss arising from the use of this material.