
Eli Lilly and Company (LLY) | Multi-Timeframe Expansion Setup
Monthly expansion confirmed above key structural breakdown

The Market Flow | November 2, 2025
Company Overview
Eli Lilly and Company is a global pharmaceutical manufacturer developing and commercializing drugs across diabetes, oncology, neuroscience, and immunology. Its portfolio includes both established therapies and rapidly scaling products in metabolic and obesity treatment — now driving outsized revenue growth.
With consistent R&D reinvestment and expanding global penetration in high-margin therapeutic areas, the company exhibits the profile of a stalwart: a mature but structurally growing enterprise with stable profitability and strong pricing power supporting continued expansion.
Technical Overview
For detailed definitions, color codes, and structural terminology,
refer to The Market Flow Methodology page.
Monthly:
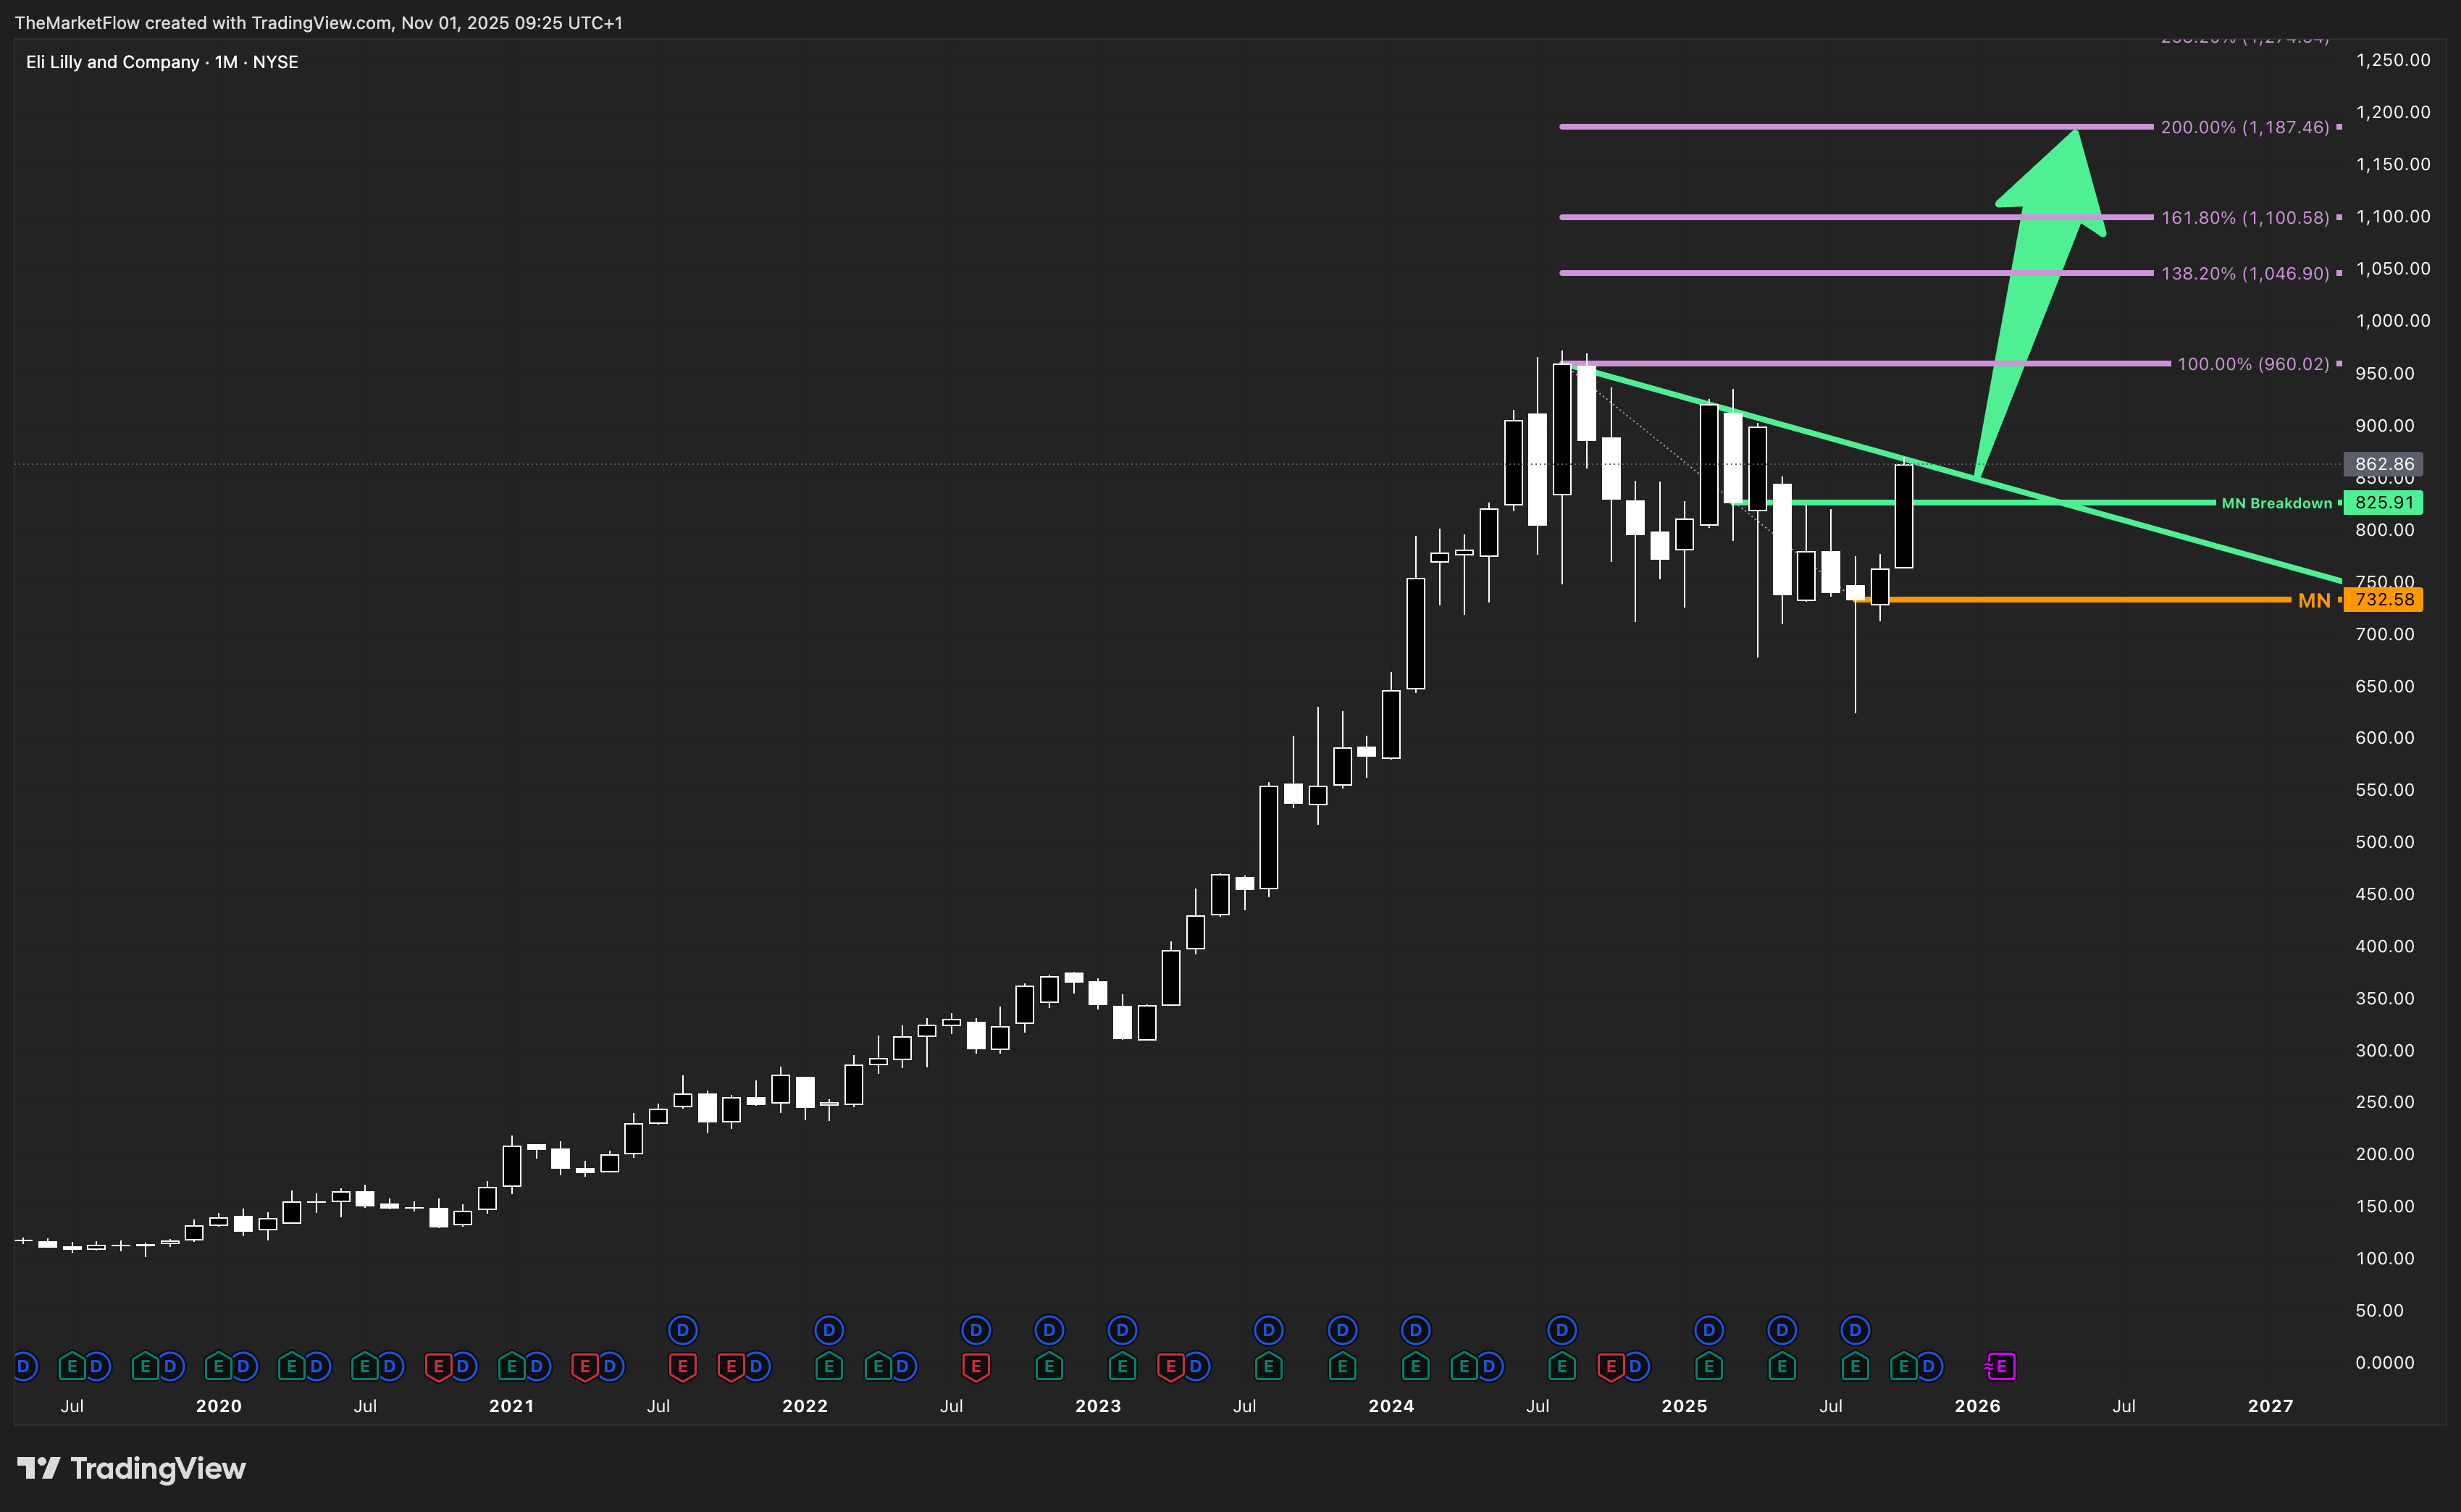
The recent monthly candle has printed a decisive marubozu close, reclaiming the highest clean breakdown at 825.91 and aligning above the descending countertrend structure. This break marks the start of a potential expansion phase after a completed corrective period, with Fibonacci projections defining the next long-term structural path toward 960.02, 1,046.90, 1,100.58, and 1,187.46.
Weekly:
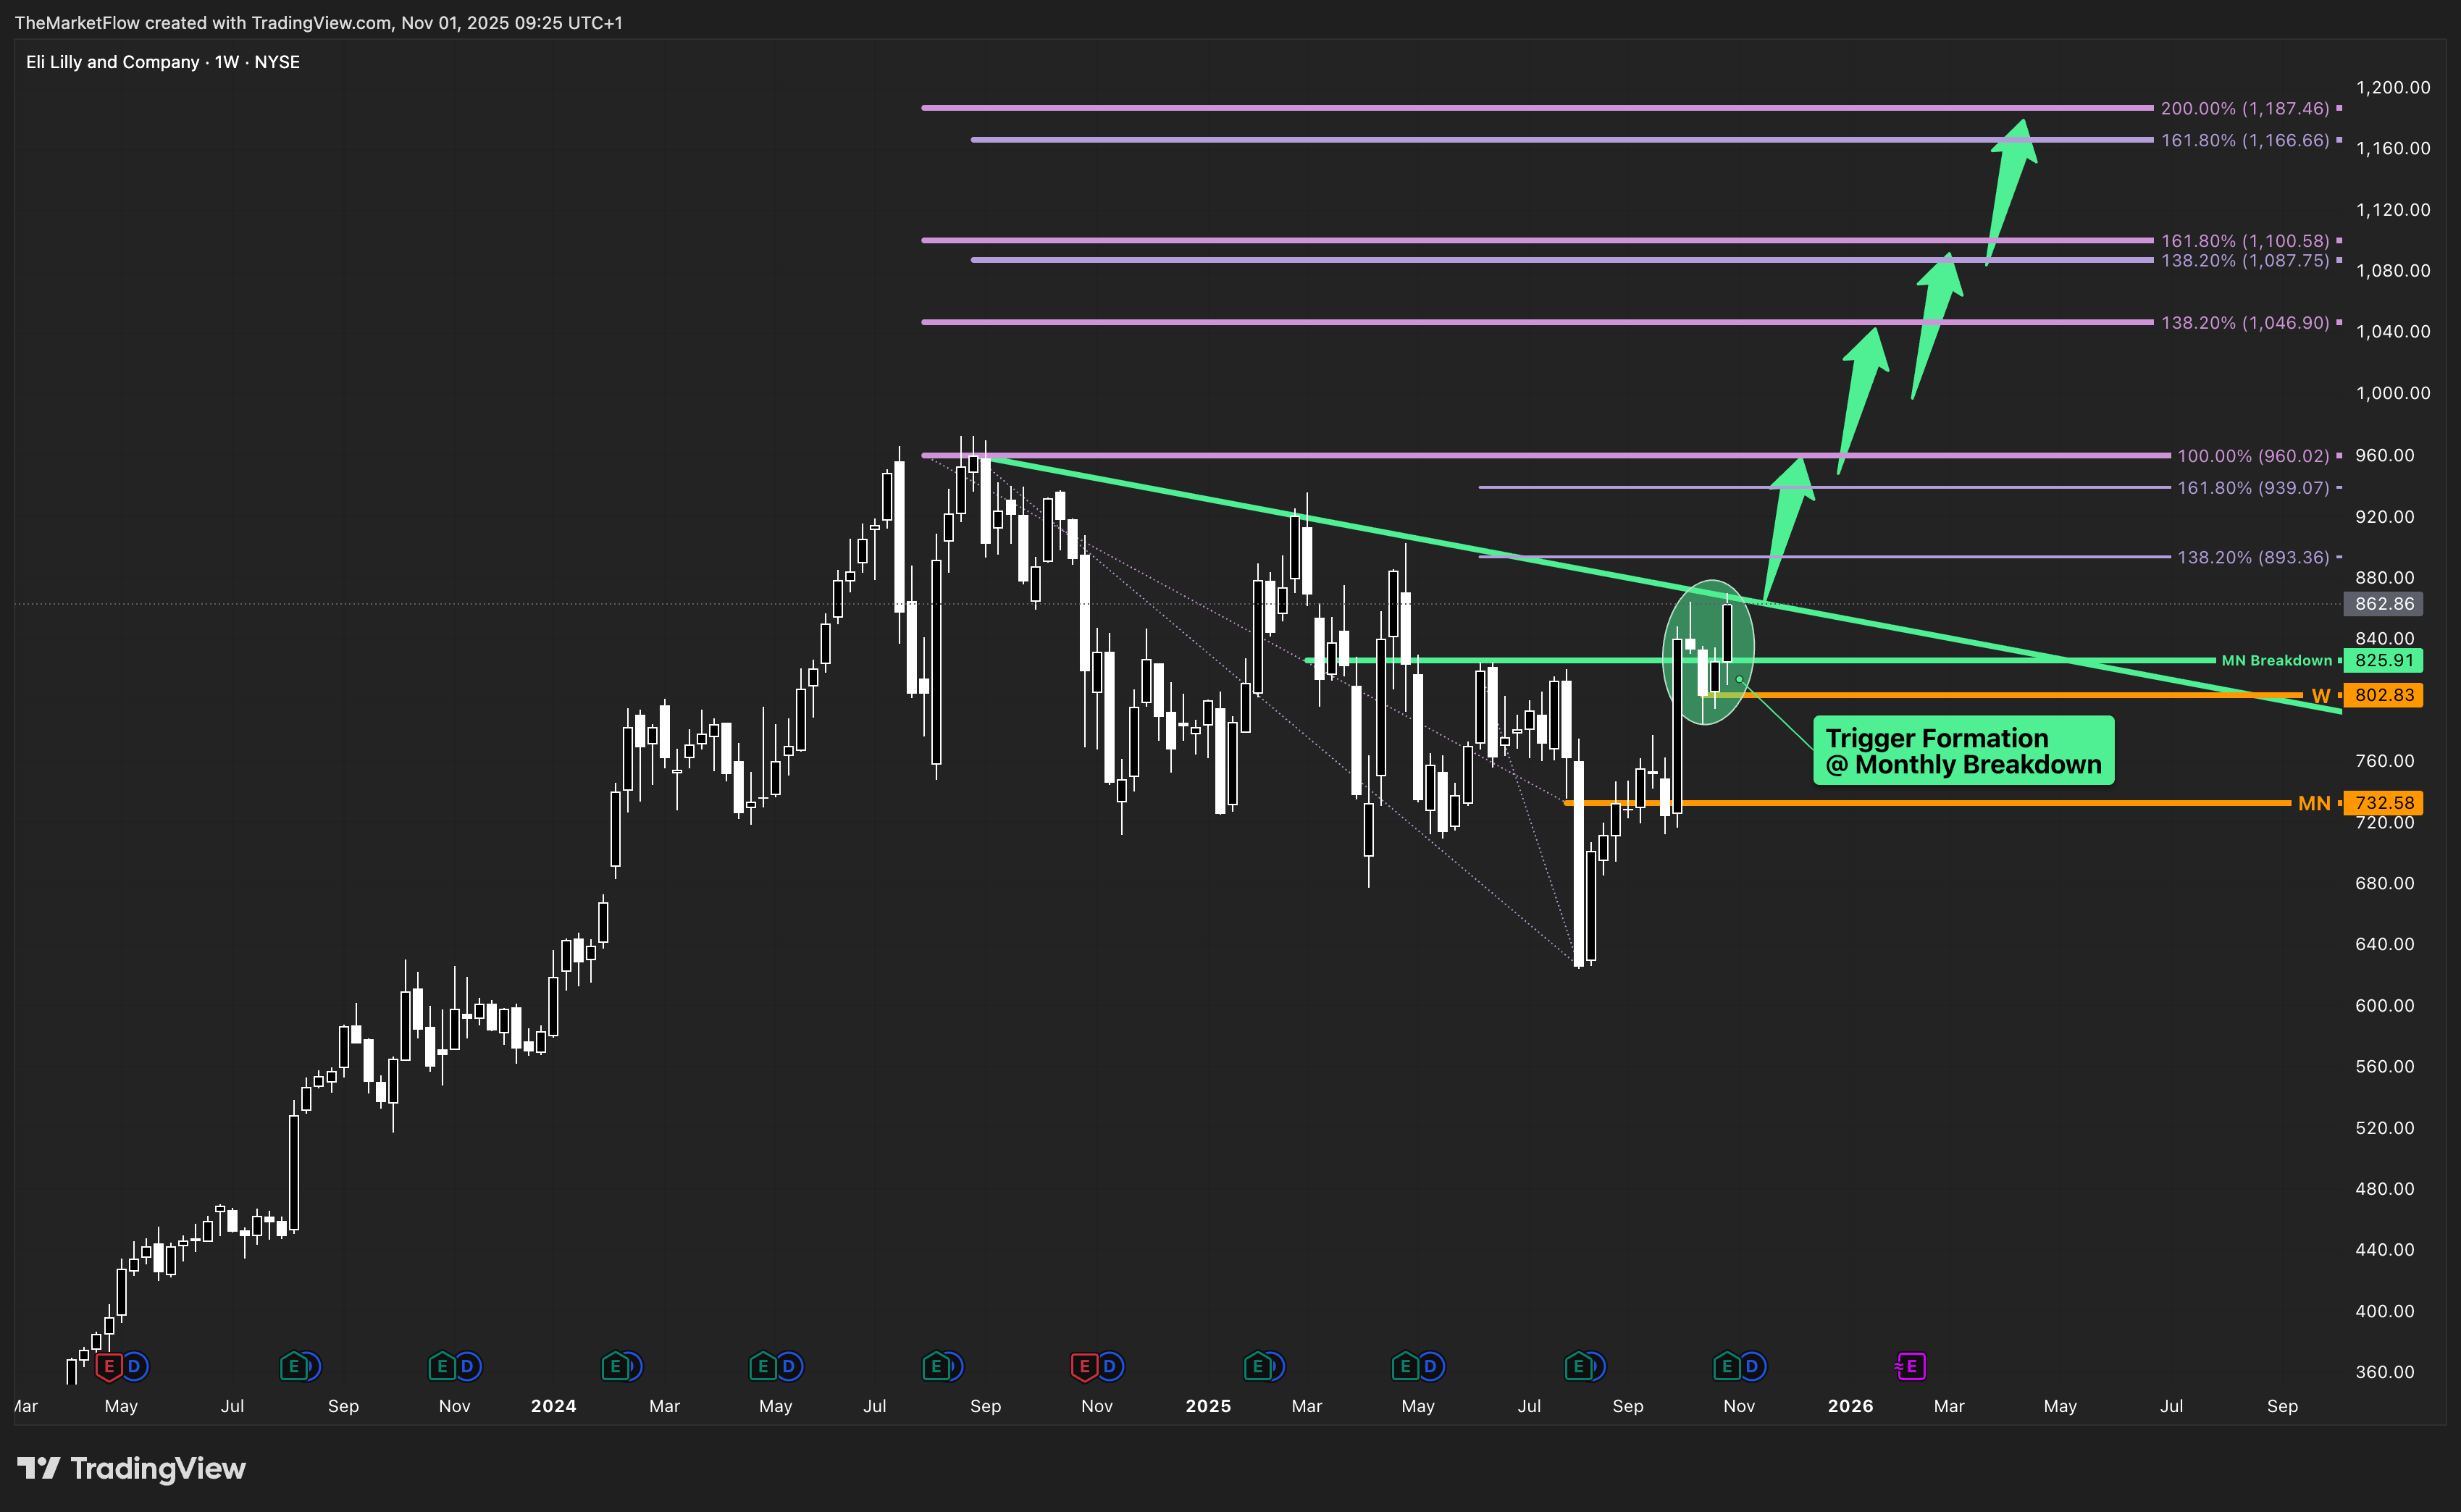
The circled segment represents a clear trigger formation emerging precisely at the prior monthly breakdown. The wave structure confirms alignment with the upward bias, validating the trigger and reinforcing expansion potential. As long as price sustains above 802.83, structure remains intact with upward continuation paths into successive Fibonacci zones identified above.
Daily:
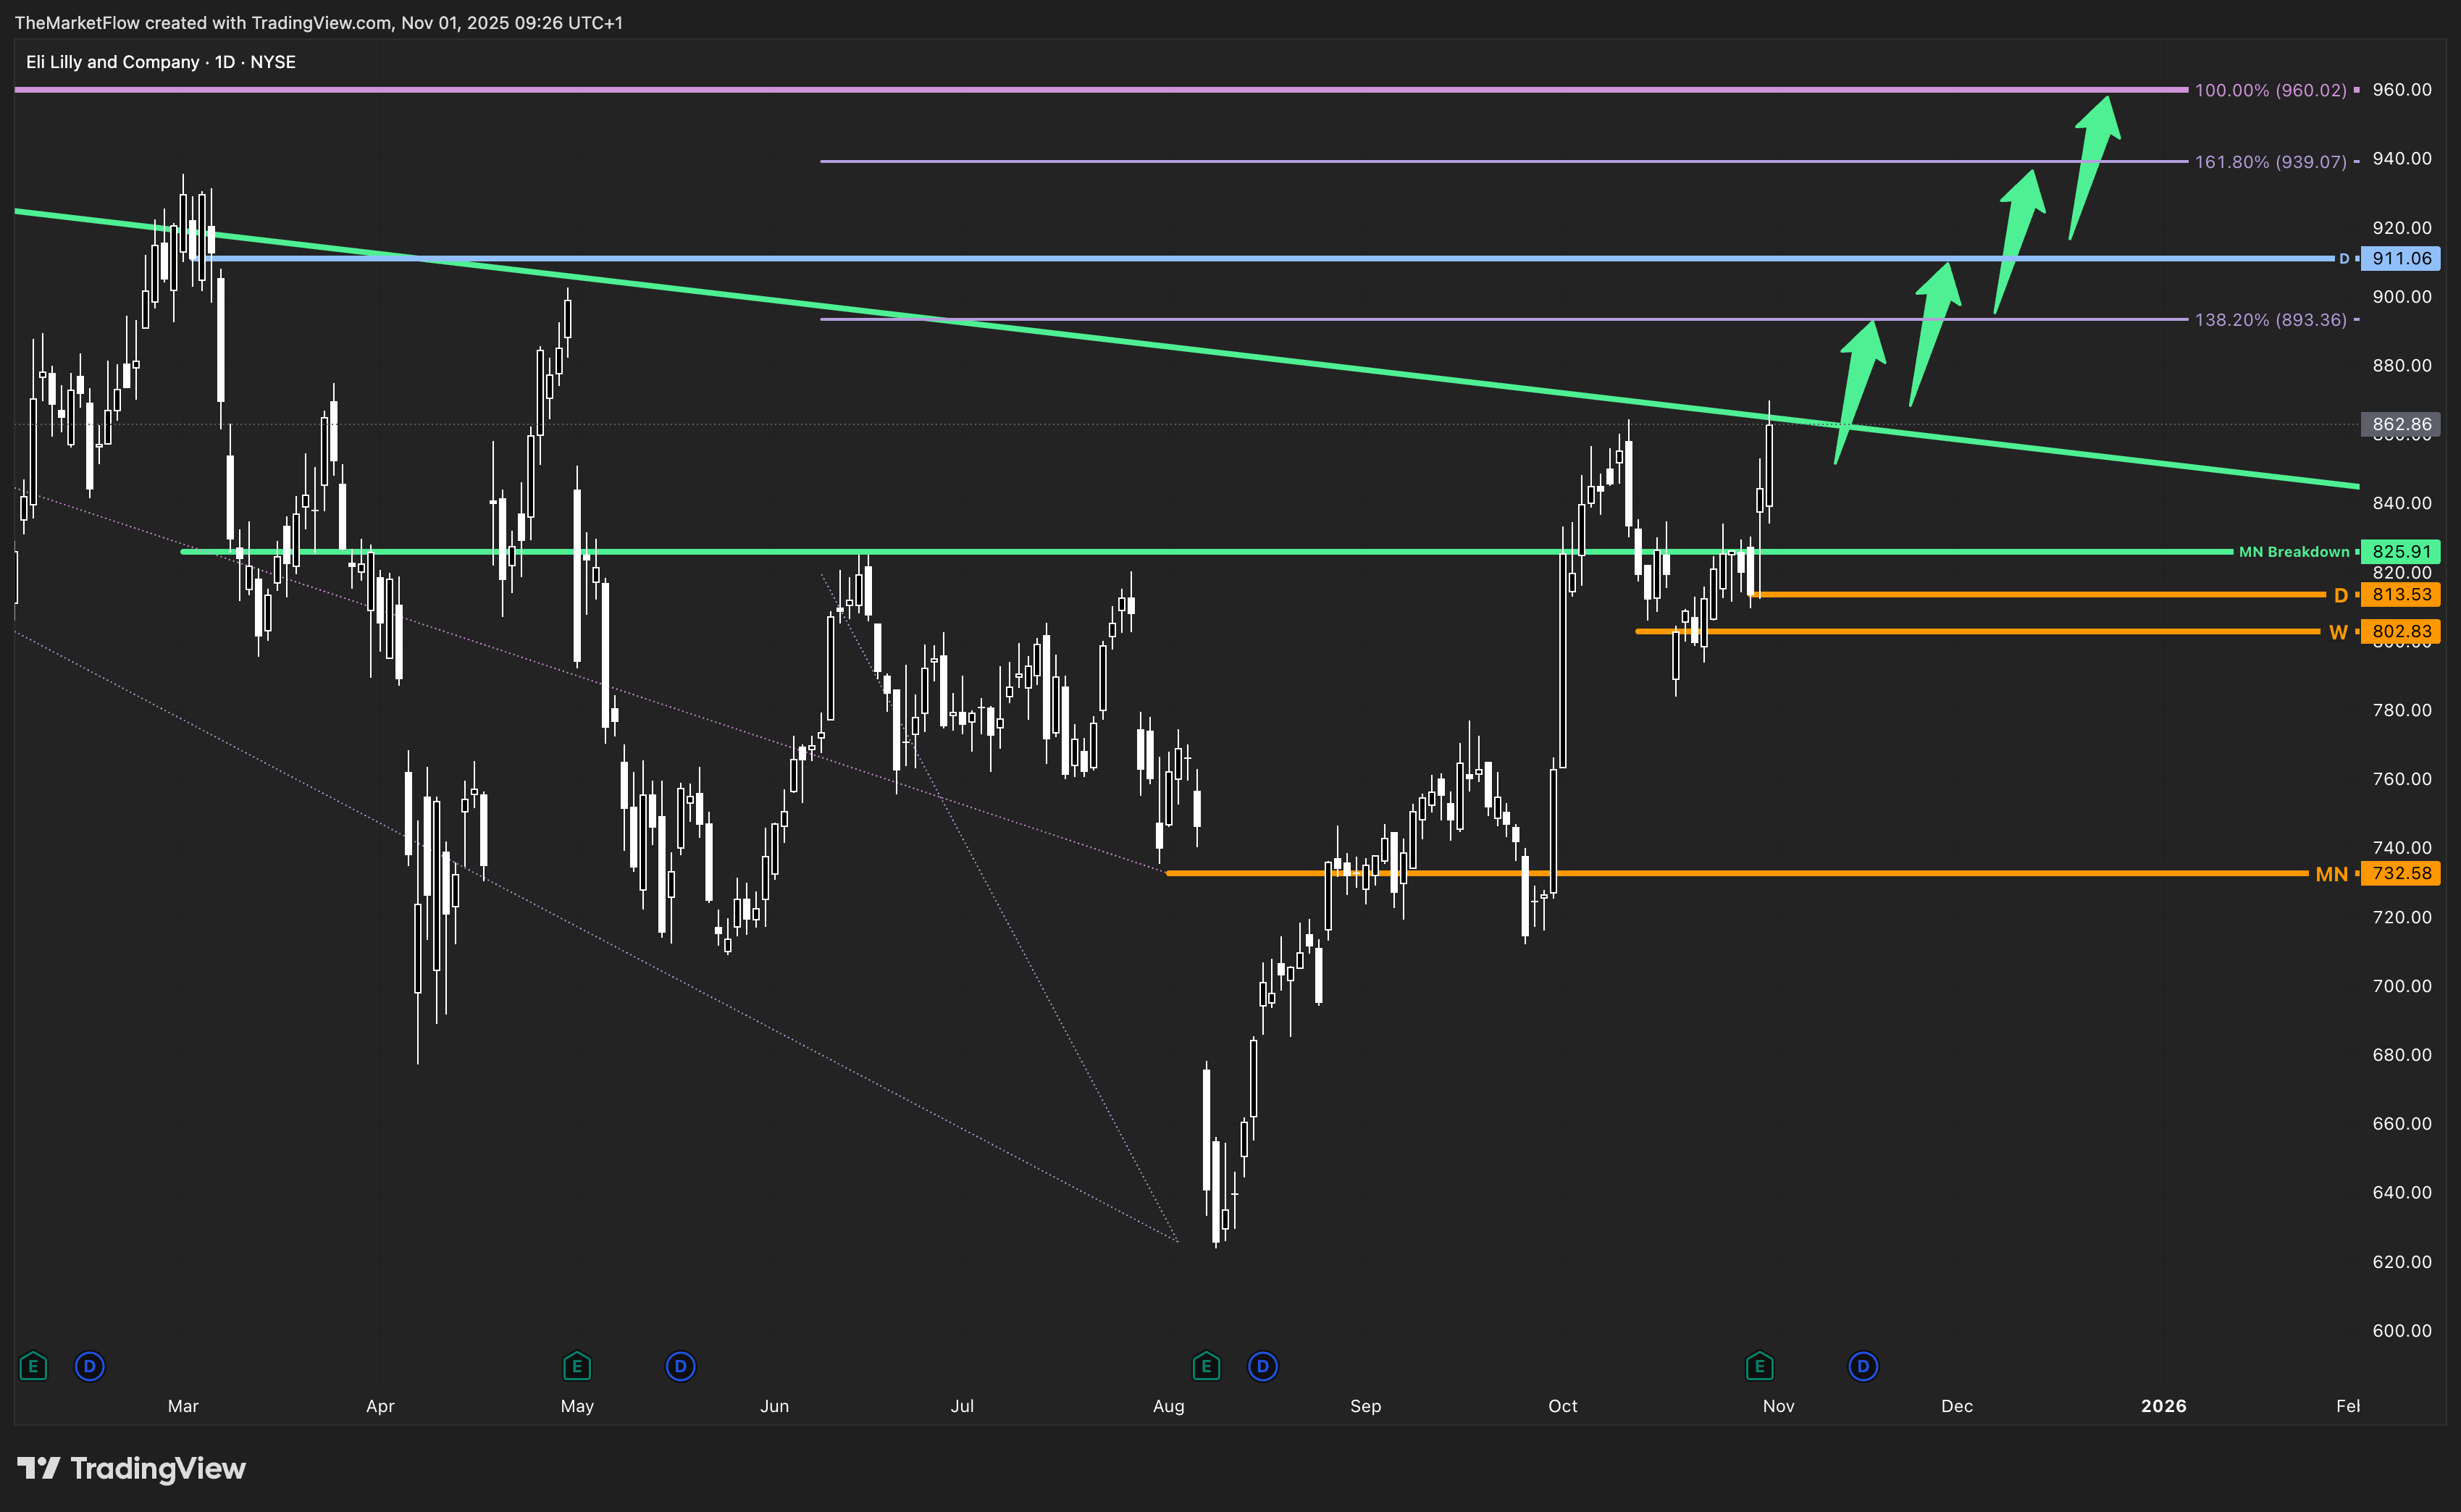
A clean breakout through the countertrend and daily structural resistance near 862.86 signals the lower-timeframe activation of this expansion. Short-term projection zones cluster between 893.36, 911.06, 939.07, and 960.02, defining the active local path. A sustained close above this confluence supports momentum follow-through toward the higher-timeframe objectives.
Trade Structure & Levels
Bias: Long above 802.83 (W)
Trigger: Weekly close above 825.91
Invalidation: Weekly close below 802.83
Phase: Expansion
Path → 893 → 911 → 939 → 960 → 1,046 → 1,100 → 1,187
ATR (14D): ≈ 28.5
Volume (20D): ≈ 4.8 M
Risk & Event Context
Eli Lilly reported earnings for the quarter ending September 2025 with a substantial upside surprise: EPS $7.02 vs. $5.69 est. (+23.33%), and revenue $17.6 B vs. $16.05 B est. (+9.64%). The strong beat underscores continued momentum from its metabolic and diabetes franchises, providing a supportive macro-fundamental backdrop for the ongoing technical expansion phase.
Conclusion
LLY has transitioned from correction into an early expansion structure across timeframes. The monthly marubozu close above the prior breakdown confirms renewed directional intent, while the weekly trigger formation reinforces alignment. Sustained closes above 825.91 keep bias firmly long toward the defined Fibonacci extensions, with 802.83 (W) serving as structural invalidation.
Disclaimer
This publication is provided for informational and educational purposes only and does not constitute investment advice, a solicitation, or a recommendation to buy or sell any security, derivative, or financial instrument. The analysis and opinions expressed reflect the author’s views at the time of writing and are subject to change without notice.
All information is derived from publicly available sources believed to be reliable, but accuracy and completeness are not guaranteed. Past performance is not indicative of future results, and no representation or warranty is made regarding future price behavior or outcomes.
Readers are solely responsible for their own investment decisions and should consult a qualified financial advisor before acting on any information contained herein.
The author and/or affiliates may hold, trade, or have a financial interest in the securities or instruments mentioned in this publication. Neither the author nor any associated party accepts liability for any direct or consequential loss arising from the use of this material.
The breakout above 825.91 with that monthly marubozu really does signal strong institutional conviction, especially given the earnings beat that exceeded expectations by over 20%. The confluence of technical expansion and fundamental momentum from the metabolic franchise creates a compeling setup. If we hold above that 802.83 weekly support, those higher Fibonacci targets toward 960 and beyond look increasingly achievable. The weekly trigger formation adds solid confrmation to the long bias.