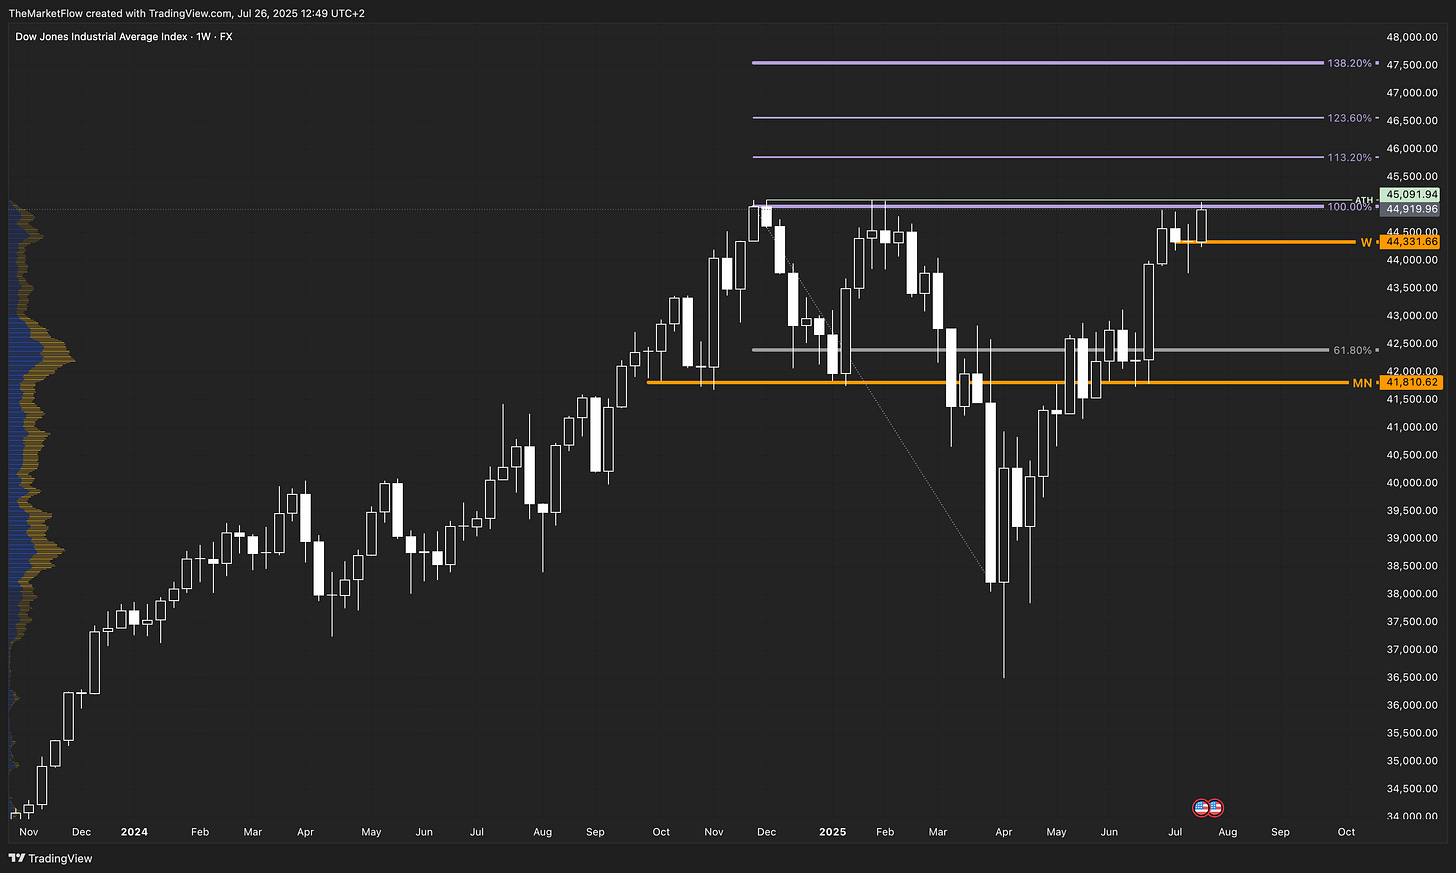
Dow Jones – Bullish Expansion Toward Fibonacci Targets
Weekly and daily structure confirms continuation; intraday trigger active above 44,919
Market Overview
The Dow Jones Industrial Average is currently in a bullish continuation phase across all major timeframes. Recent price action has cleared prior resistance levels and is now holding above key pivots, with a strong alignment toward higher Fibonacci target zones. A clean breakout has occurred above the previous daily range, setting the stage for a structured advance.
Long-Term Outlook
On the weekly chart, price has reclaimed the major resistance zone at 44,919.96, the 100% extension from the previous weekly impulse leg. This level had acted as a ceiling for several months, aligning with the previous ATH and forming the top of a broader consolidation. With a weekly close above this level, the market validates bullish continuation, targeting the 113.20% (≈45,600) and 123.60% (≈46,000) weekly Fibonacci projections. The weekly pivot level at 44,331.66 remains the key structural support.
The Daily Chart
The daily structure confirms the expansion phase. After a corrective pullback to the 61.80% retracement at 44,339.11, price resumed upward movement and broke through the 100% daily extension at 44,919.96. The chart now shows a potential stair-step continuation, with target Fibonacci zones projected at:
138.20%: ≈45,091
161.80%: ≈45,300
These targets are consistent with the ongoing momentum breakout above consolidation.
Short-Term Dynamics
The H4 chart shows a clean breakout from the prior range and a stair-step continuation structure unfolding. The prior resistance near 44,919.96 is now acting as a base. The impulse leg launched from the H4 pivot at 44,706.21, and higher lows have formed since. If price holds above the breakout zone, the intraday trend remains valid.
The H4 structure also aligns with Fibonacci extensions, suggesting the next targets are:
138.20% H4: ≈45,091.94
161.80% H4: ≈45,300
200% H4: ≈45,700
113.20% Weekly: ≈45,900
Trigger Conditions
Long Trigger: Break and hold above 44,919.96 (daily resistance and 100% Fib) confirms continuation
Short Trigger: None valid unless price loses 44,706.21, invalidating short-term bullish structure
Target Zones
H4 Target Fibonacci: 45,091.94, 45,300, 45,700
Weekly Target Fibonacci: 45,600, 46,000, 47,000
Daily Target Fibonacci: 45,091.94, 45,300
ATH/Breakout Base Level: 44,919.96
Validity
The daily pivot at 44,331.66 remains the key structural level. A sustained break below this level would invalidate the current continuation setup.
Summary
Dow Jones is showing clear bullish structure across monthly, weekly, and daily charts, supported by a clean breakout on H4 and the start of a Fibonacci expansion leg. Holding above 44,919 confirms momentum and opens the path to successive Fibonacci targets. Traders should monitor for potential pullbacks into the breakout zone for continuation setups.
What’s your take on this Dow structure? Is the expansion leg convincing enough? Share your view in the comments—let’s compare frameworks.


