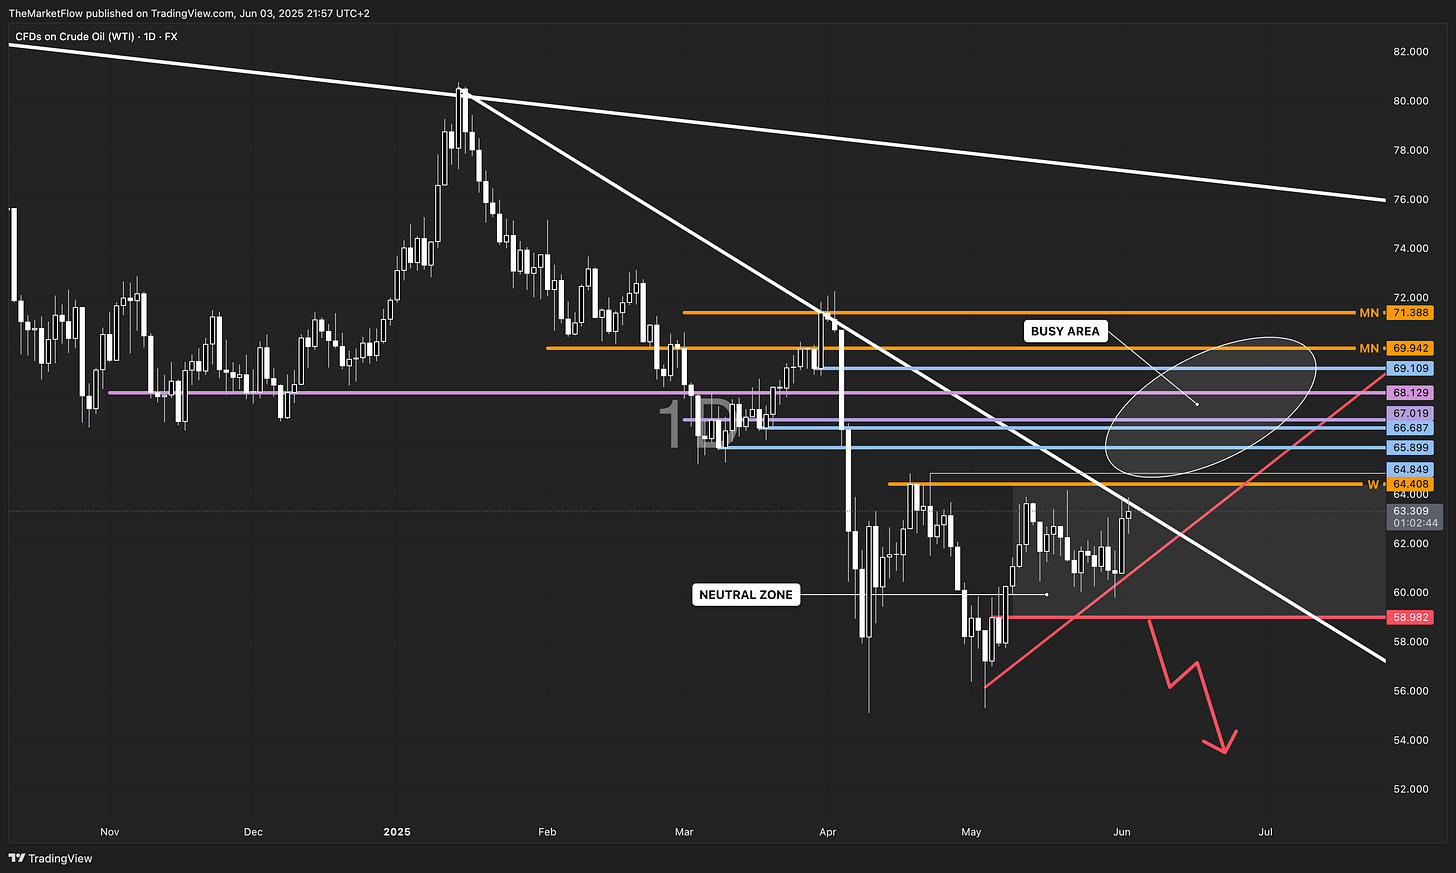
Crude Oil: Rally or Just a Dead Cat Bounce?
Multi-timeframe resistance threatens the short-term bullish case
Despite recent upward momentum, WTI Crude Oil remains under pressure from dominant macro trends. I analyze CFDs in order to have a smoother price action.
The monthly and weekly charts confirm a clear and active bearish structure, with lower highs and a firmly respected descending trendline across all major timeframes.
The short-term rally that has captured traders’ attention could be just a retracement in a broader downtrend. Price is now approaching a busy area loaded with resistance levels:
Monthly breakdowns at 71.38, 69.94, and 68.12
Daily and weekly resistance zones clustering between 65.90 and 68.10
A significant weekly pivot at 64.41, which already paused the momentum once

This confluence zone acts as a magnet and a minefield: while it may pull prices toward it, each level also has the potential to halt or reverse the move.
On the daily chart, the market is navigating a neutral zone — any failure to reclaim the cluster of breakdowns could trigger renewed selling. The longer-term monthly chart shows no structural trend change, and unless we see a confirmed break of the descending trendline with follow-through above 71.38, the bears remain in control.
Key Levels to Watch
Resistance Zone: 65.90 – 71.38 (multi-timeframe cluster)
Support: 58.98 (daily level), 42.79 (monthly key structure)
Conclusion
This rally may look convincing on lower timeframes, but from a top-down view, it still appears countertrend. Without a confirmed breakout above the resistance cluster, bulls are fighting gravity. The burden of proof is on the buyers, and the monthly chart suggests they may soon run out of fuel.


