
Bitcoin: Diamond of Doubt in a Long-Term Bullish Structure
Price compresses in a diamond pattern as bulls and bears prepare for the next impulse. Expansion or correction? Key levels define Bitcoin’s next directional move.

Summary
Bitcoin remains in a long-term uptrend with bullish targets ahead, but short-term uncertainty is re-emerging. A diamond-shaped consolidation on the daily timeframe reflects this hesitation, with both bullish and bearish pathways clearly mapped out.
Technical Analysis
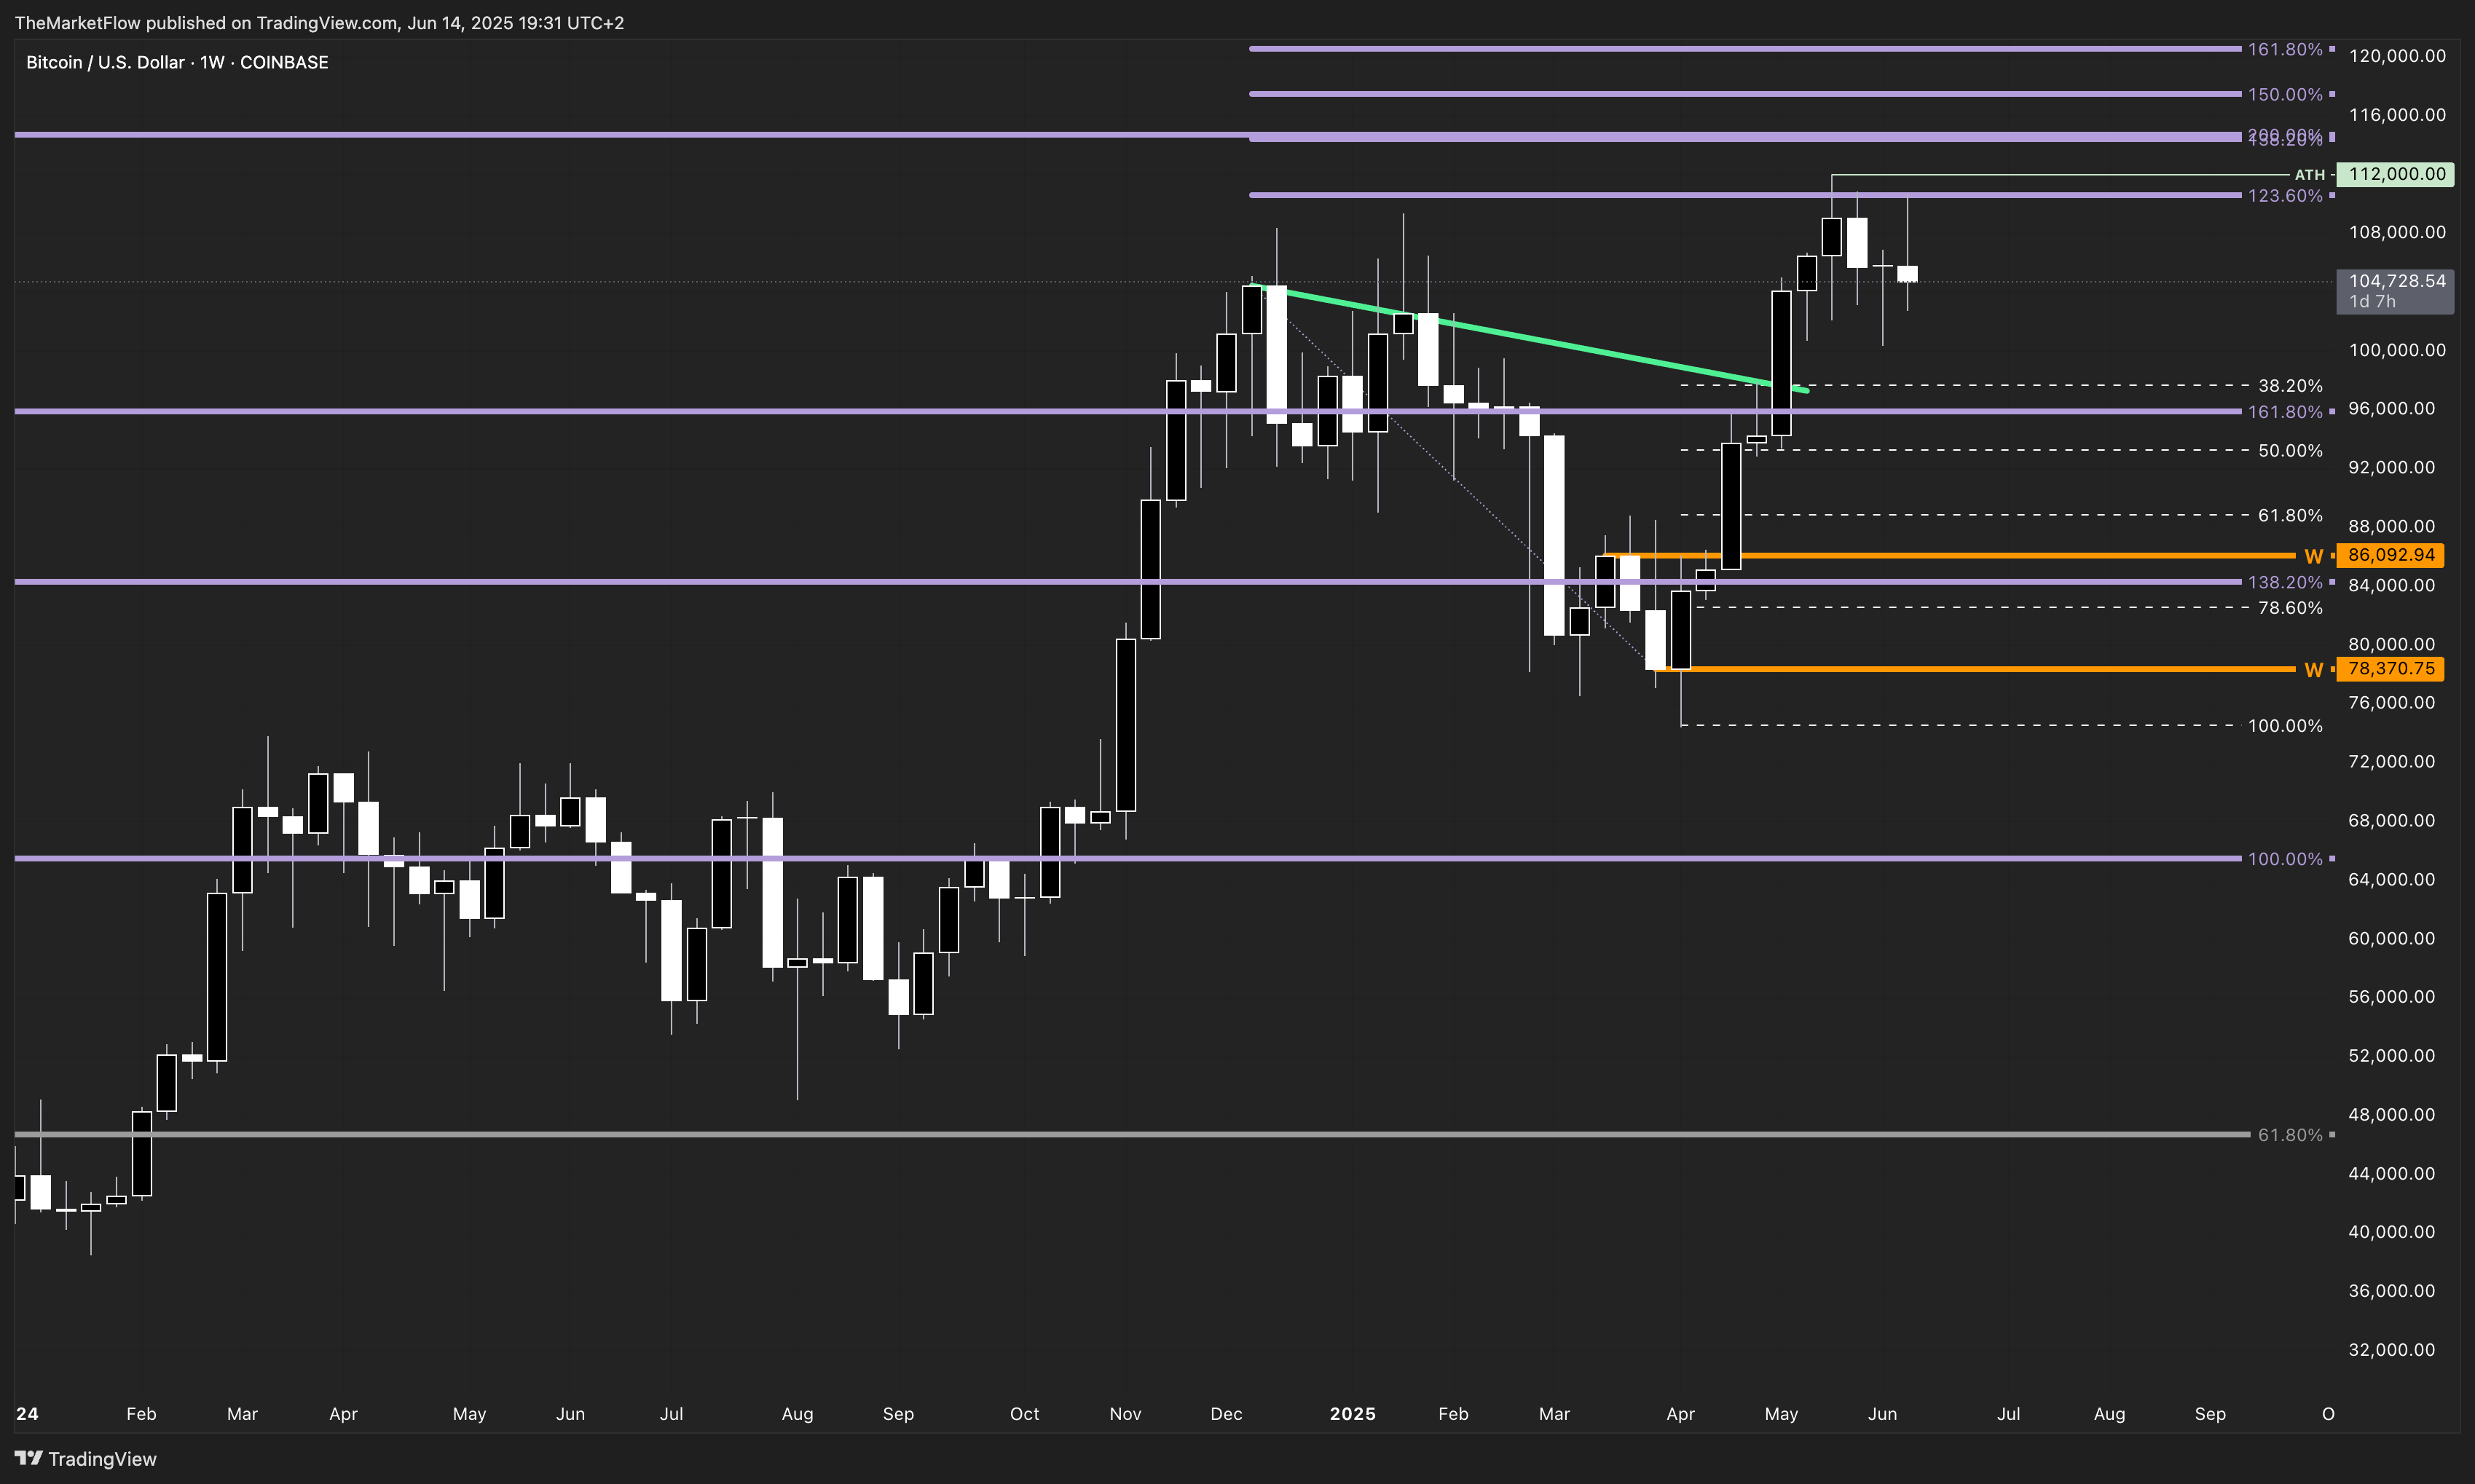
On the long-term view, Bitcoin is advancing toward the weekly target Fibonacci 138.2, with the higher timeframes still aligned in favor of the bulls. The break of the previous macro countertrend and the strong bullish impulses suggest the potential for continuation toward the 112,000 level and beyond, with higher Fibonacci targets around 115,000–117,000 and even 120,000.
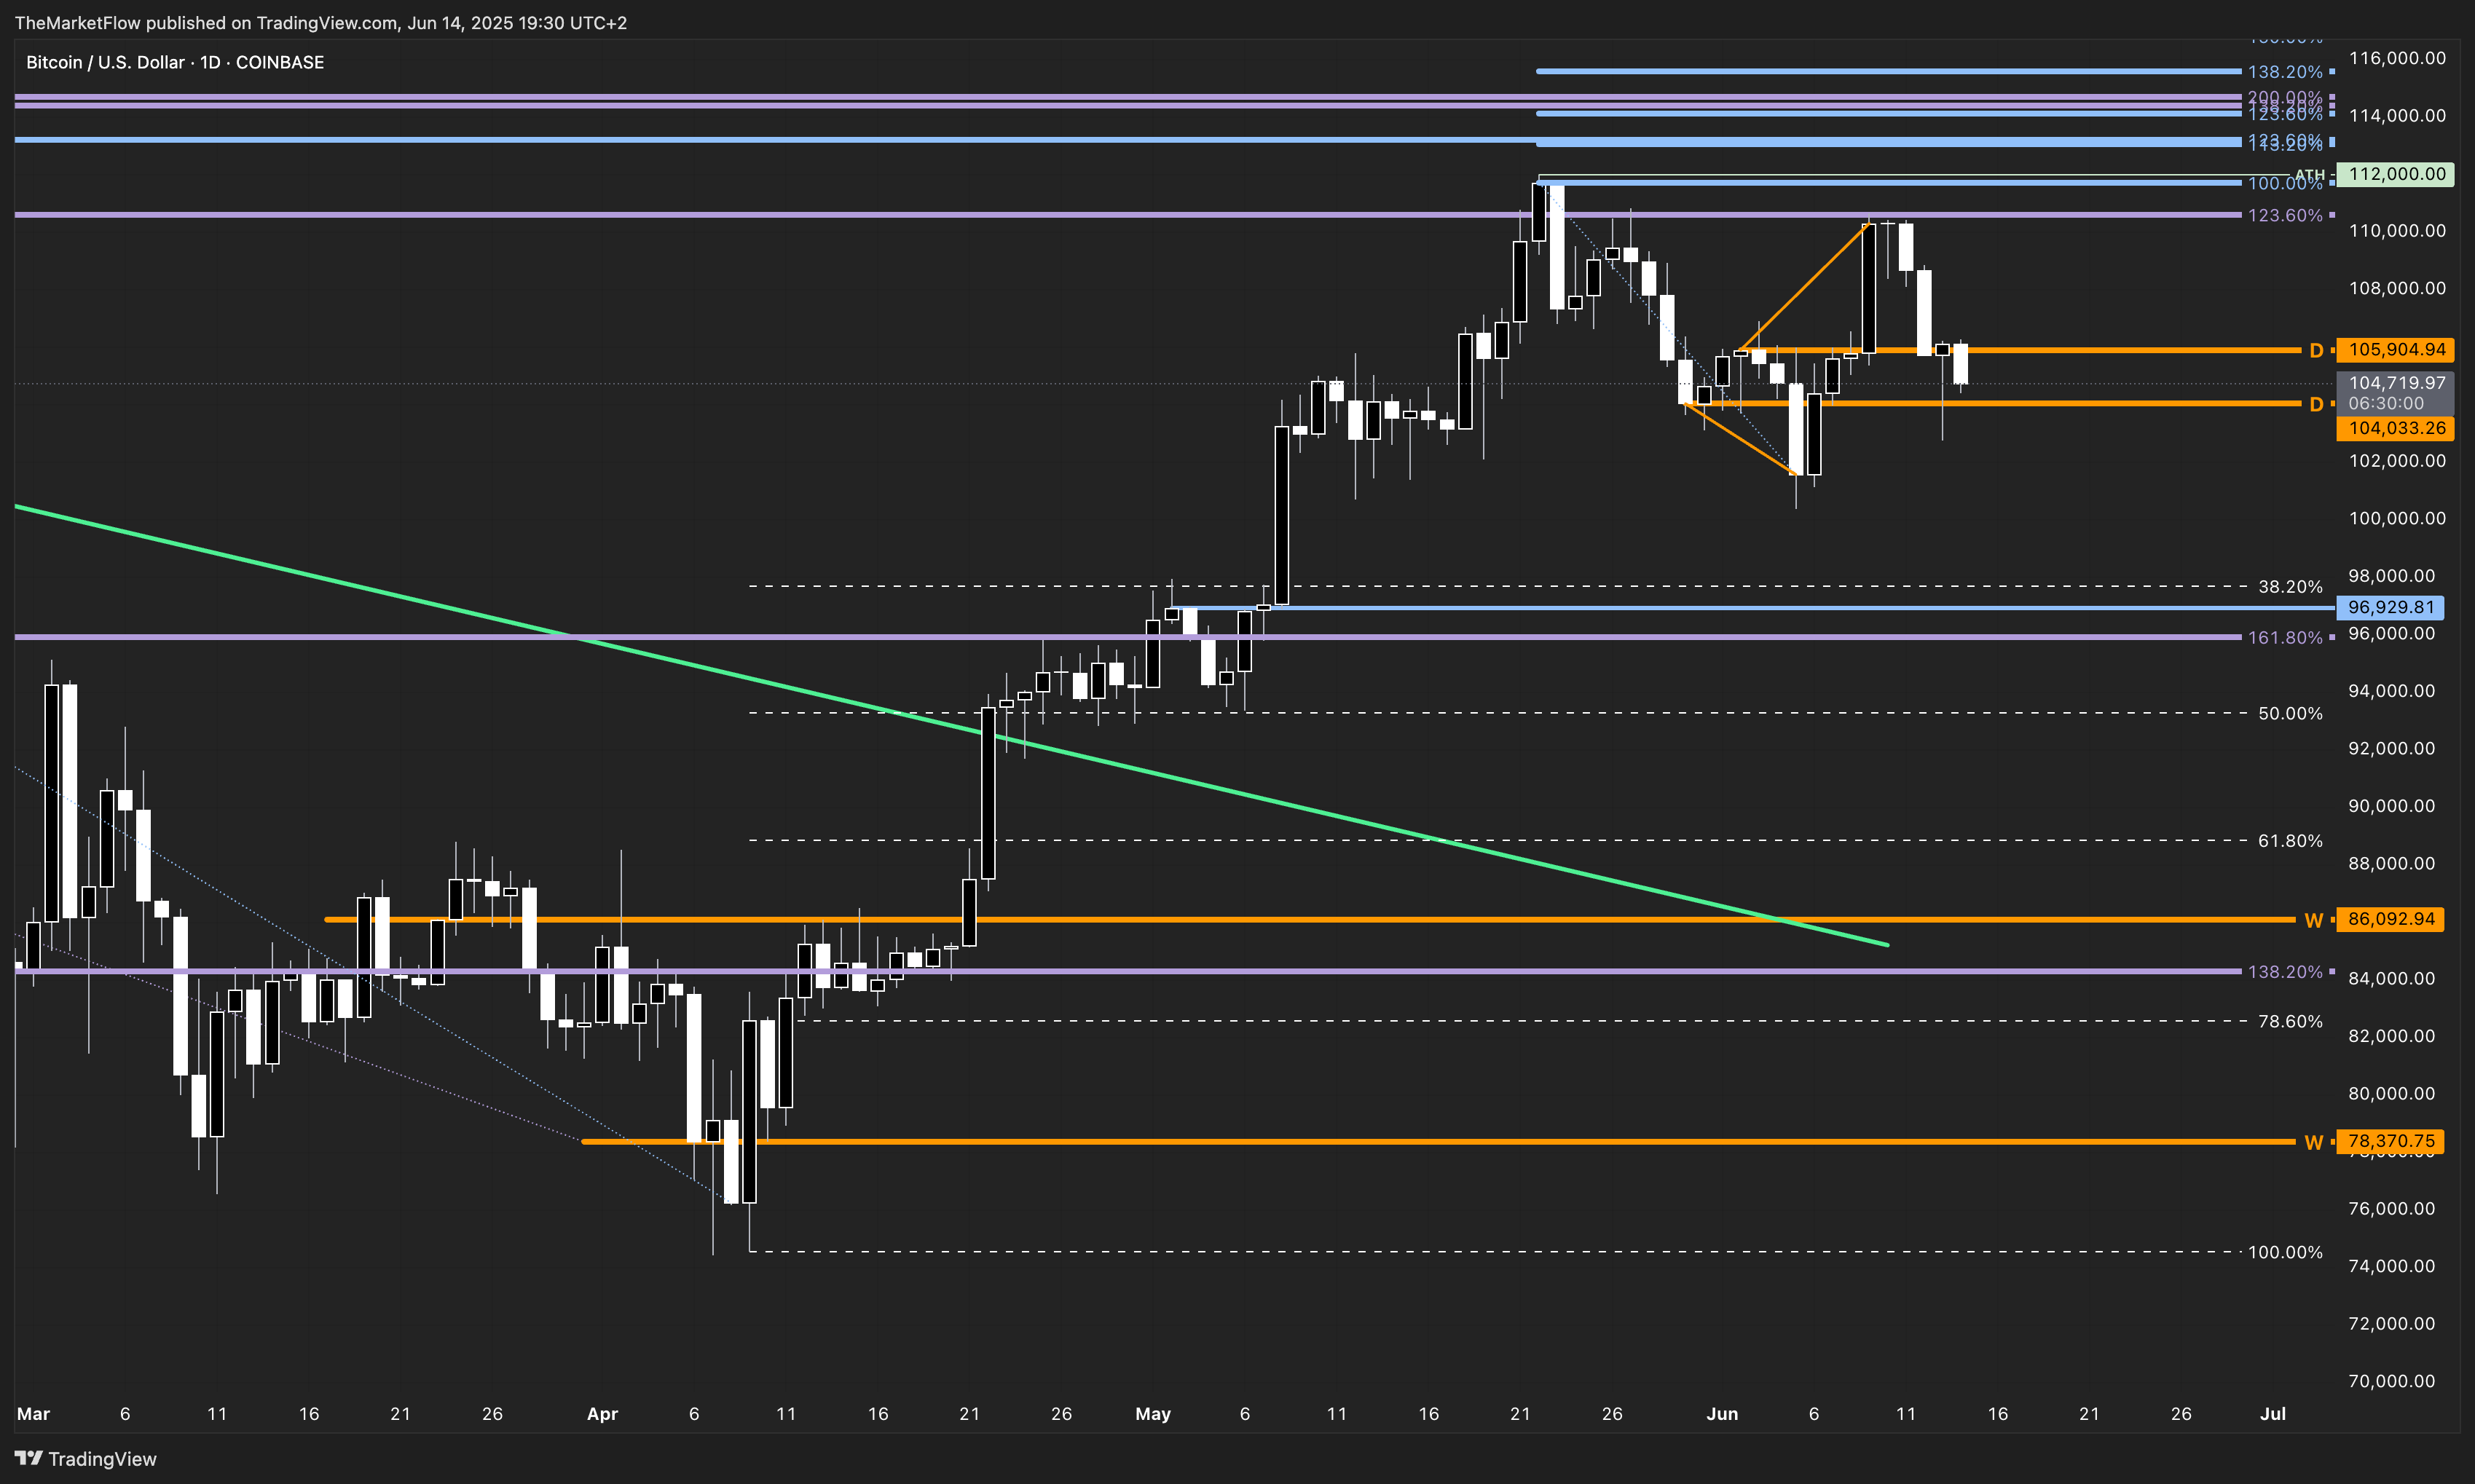
However, on the daily timeframe, uncertainty arises again. After briefly breaking above the recent daily pivot zone, the market has re-entered a diamond formation, indicating indecision. If price breaks below the inner zone of the diamond, there is a chance that BTC will revisit the correction Fibonacci 38.2%, currently sitting near 97,700.
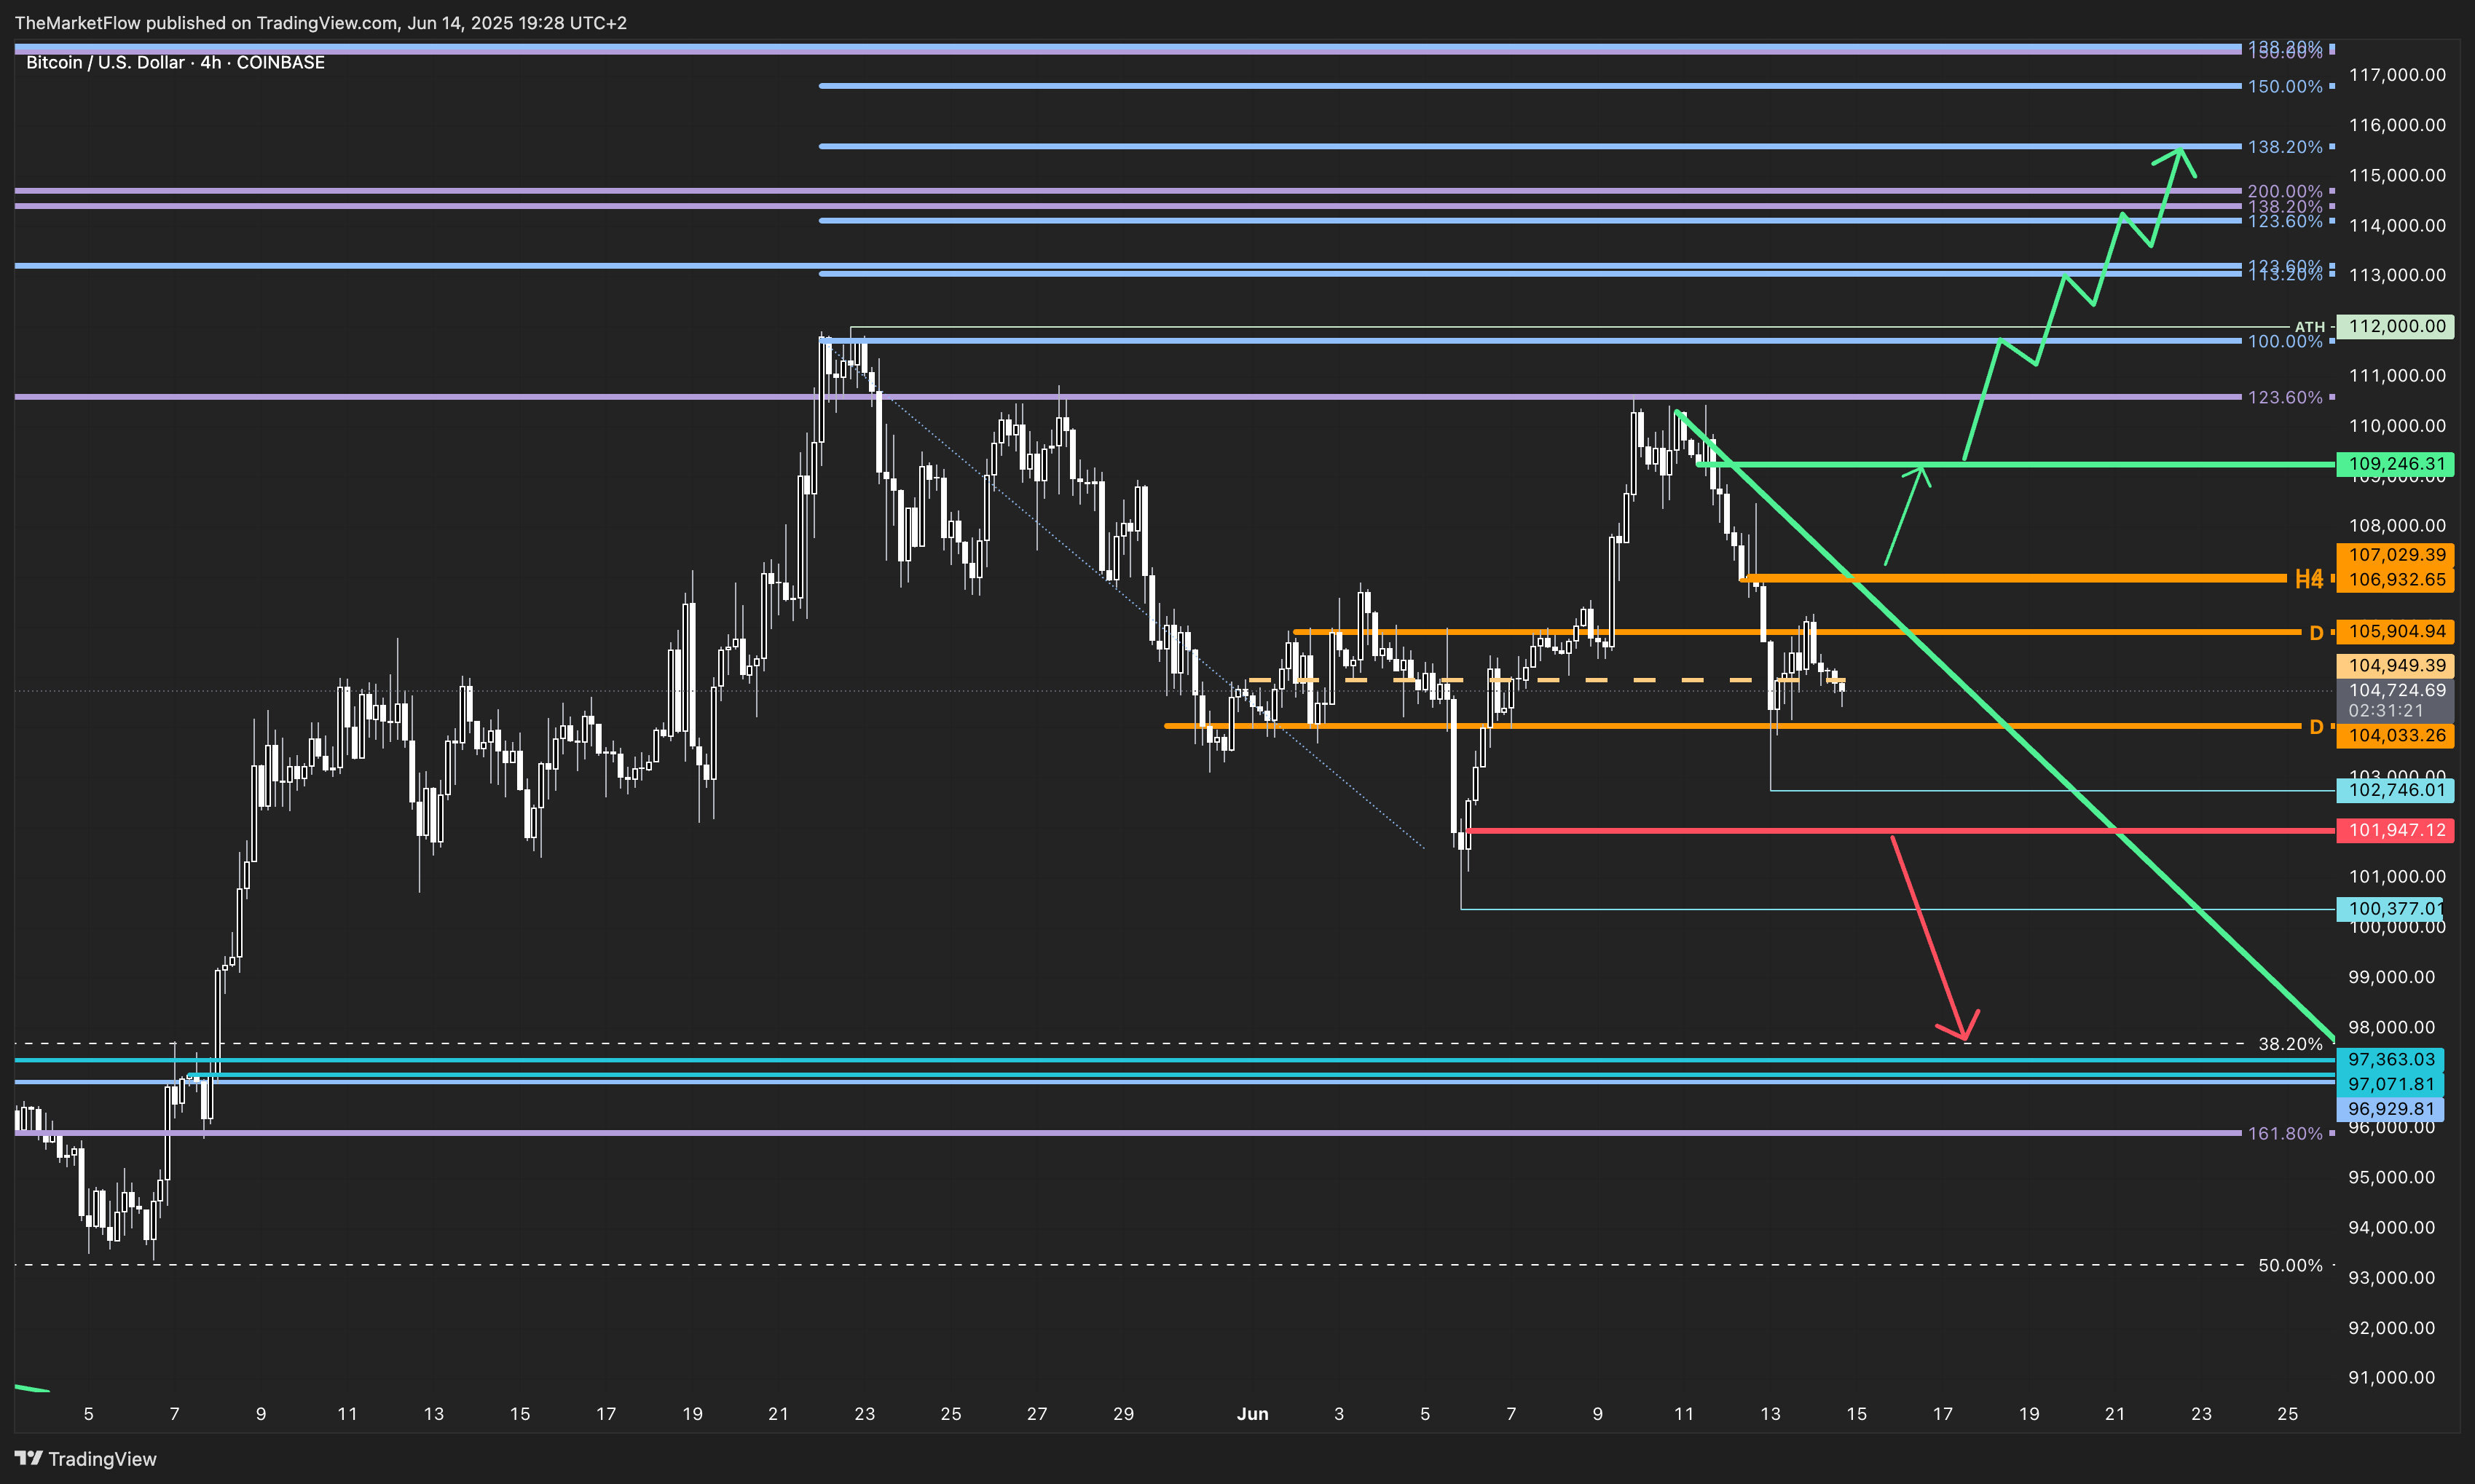
On the short side, there’s a clean H1 breakout level (red) that, if broken, could validate this short-term bearish move. Bears should monitor the sell-side liquidity around this zone and consider managing risk proactively as price approaches it.
On the long side, bulls need to reclaim the H4 pivot zone and break the countertrend line decisively. A clean H4 breakdown level (green) marks the start of a potential expansion phase. Once broken, it would validate a renewed bullish expansion targeting the daily and weekly Fibonacci levels, with 112,000, 114,000, and beyond.
Outlook & Key Levels
Bullish confirmation: Above the H4 pivot zone and countertrend line, targeting 112K+ (all-time high)
Bearish continuation: Below the diamond’s inner base and H1 breakout, targeting 96-98K zone
Key zone to watch: The orange daily pivot band around 104–106K – a battleground for short-term direction
I don’t forecast – I analyze and react at key levels.
This analysis focuses purely on trend structure, phases, and key reaction zones across multiple timeframes, without bias. Follow the chart, not predictions.
📩 If you enjoy these structured breakdowns, feel free to like and comment — and if there’s a market you’d like covered, just hit reply!