Bitcoin – Daily Bull Trend Holds as Weekly Expansion Hits Fibonacci Target
Potential continuation toward upper Fibonacci zones if daily structure remains intact
Market Overview
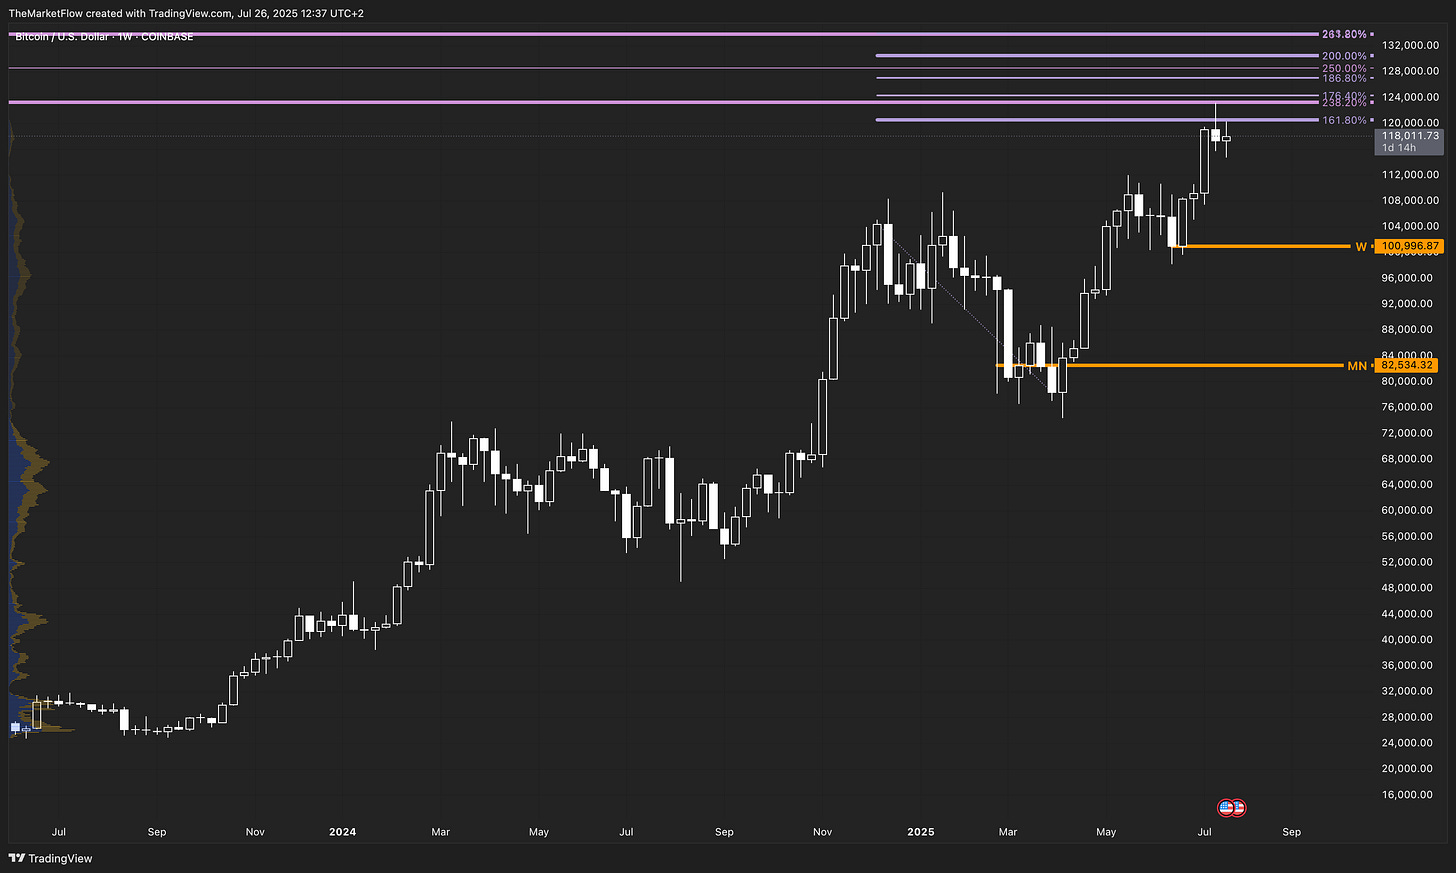
Bitcoin remains in a strong bullish structure across all major timeframes. The weekly expansion has just tagged its 161.8% target Fibonacci, while the daily uptrend is still holding above its key pivot. As long as the daily structure stays intact, higher timeframe Fibonacci levels remain in play as continuation targets.
Long-Term Outlook
The weekly chart confirms a clear expansion phase following a clean breakout from the pivot zone near $101,000. Price has now hit the 161.8% weekly target Fibonacci near $118,000, which aligns with a temporary consolidation. The broader structure remains bullish, with no indication of major distribution or reversal. Higher Fibonacci targets at 176.4% ($124,000) and 186.8% ($126,000) become relevant if price resumes upward movement.
Monthly structure is even more supportive, with price cleanly holding above the macro pivot at $82,534.32, reinforcing the validity of the multi-month bullish continuation.
The Daily Chart
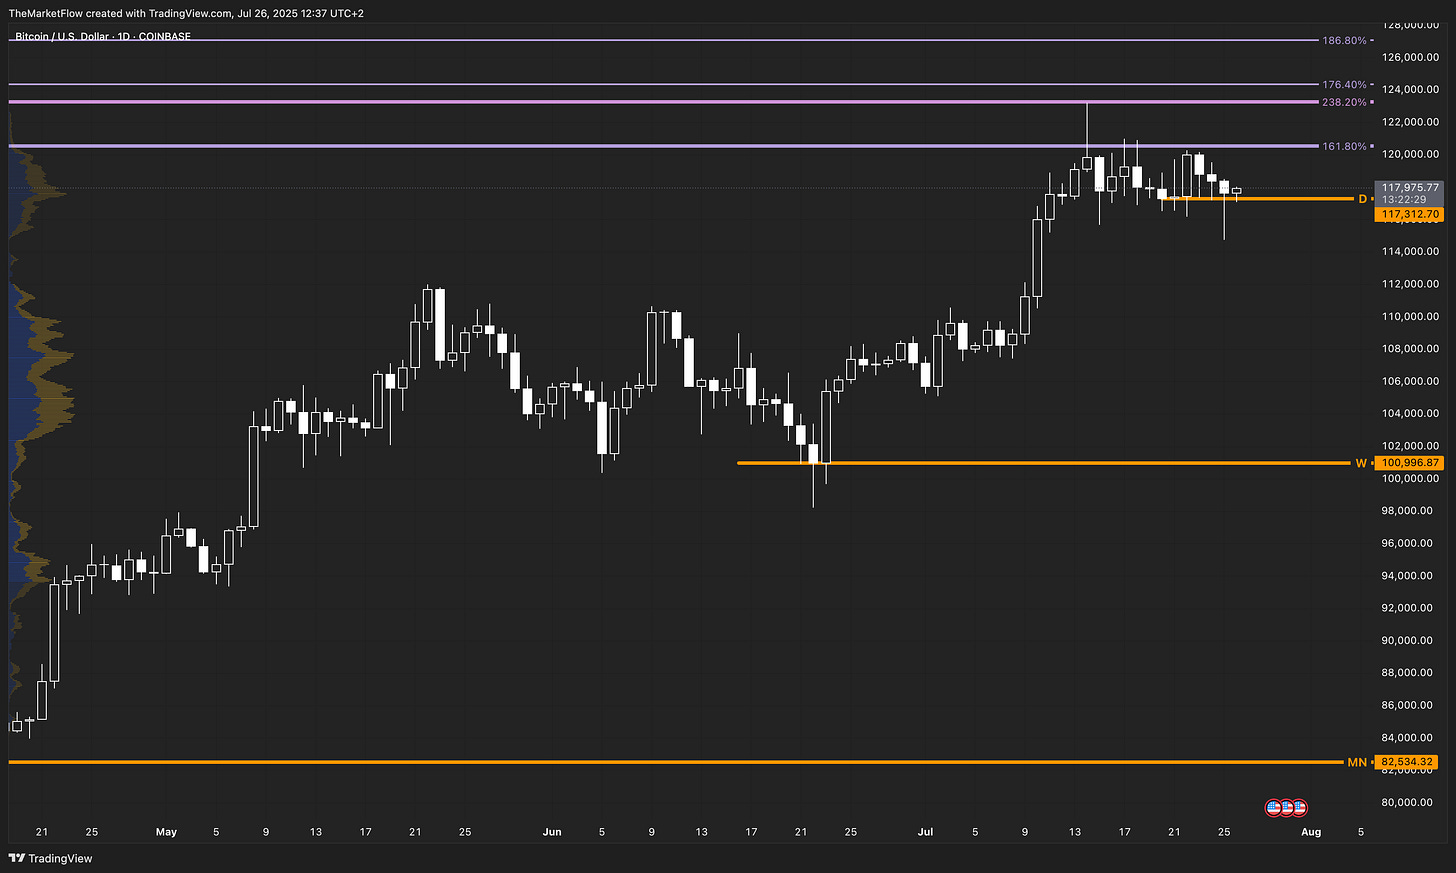
Daily trend remains structurally intact. Price has held above the daily pivot at $117,312.70 despite several tests, indicating that the ongoing move is a shallow correction rather than a full reversal. The recent dip was quickly reclaimed, preserving the higher-low sequence and confirming continued strength in the bull trend. The current consolidation sits just below the $118,000 level, which was the 161.8% weekly target—a logical area for pause before the next leg.
Short-Term Dynamics
On the H4 chart, a descending countertrend structure has been broken to the upside. The breakout above $118,470.55 and especially the next level at $119,176.25 suggests bullish continuation. Price remains supported above the H4 pivot and daily pivot level, consolidating within a narrow range. If this consolidation resolves upward, the structure implies a stair-stepped path toward the upper H4 target Fib levels.
Trigger Conditions
Long Trigger: Break and hold above $119,176.25
Short Trigger: Break below daily pivot at $117,312.70 (would negate current long setup)
Target Zones
Weekly Target Fibonacci:
176.4%: ~$124,000
186.8%: ~$126,000
200%–263.8%: $128,000–$132,000
H4 Target Fibonacci:
138.2%–161.8%: $124,000–$127,000
Validity
The daily pivot at $117,312.70 defines the setup’s validity. A sustained break below would signal a deeper correction and delay further upside.
Summary
Bitcoin’s daily bullish trend remains intact as the weekly expansion hits its initial Fibonacci target. Consolidation just below $118,000 is a healthy pause rather than a structural reversal. If price reclaims $119,176.25, the next leg higher could aim for the upper weekly and H4 Fibonacci targets. A break below $117,312.70 would invalidate the current bullish setup and shift focus to deeper retracement levels.
What’s your take on this Bitcoin structure? Share your view in the comments—let’s compare frameworks.


