
Bitcoin – Countertrend Break Signals Possible Upside Continuation
Daily structure breached; H4 breakdown target at $109,246.31 now in play

Market Overview
Bitcoin has broken above the previous countertrend pivot on the daily chart, signaling a potential transition from corrective structure back into trend continuation mode. This move followed a clean interaction with a key confluence zone: the 138.2% daily target Fibonacci aligning closely with the 38.2% correction Fibonacci near $98,350. With this inflection, the structure now suggests renewed upside possibilities—provided the new daily pivot holds.
Weekly Structure

The weekly trend remains bullish following a recent break of the long-term countertrend line. The current weekly candle shows a modest reaction higher after testing weekly structural support, anchored at $100,996.87 (also the new daily pivot), with higher targets visible at $112,000 (ATH) and $113,000 (weekly 123.6% target Fibonacci).
Daily Chart

The decisive bullish daily candle that pushed above the prior short pivot zone confirmed a break in the daily countertrend structure. This move was triggered after price tapped the daily 138.2% target Fibonacci and bounced—an area overlapping the correction 38.2%, suggesting a high-probability exhaustion zone for the correction phase. As long as price holds above the newly established daily pivot at $100,996.87, the structure favors continued upside exploration.
H4 Timeframe
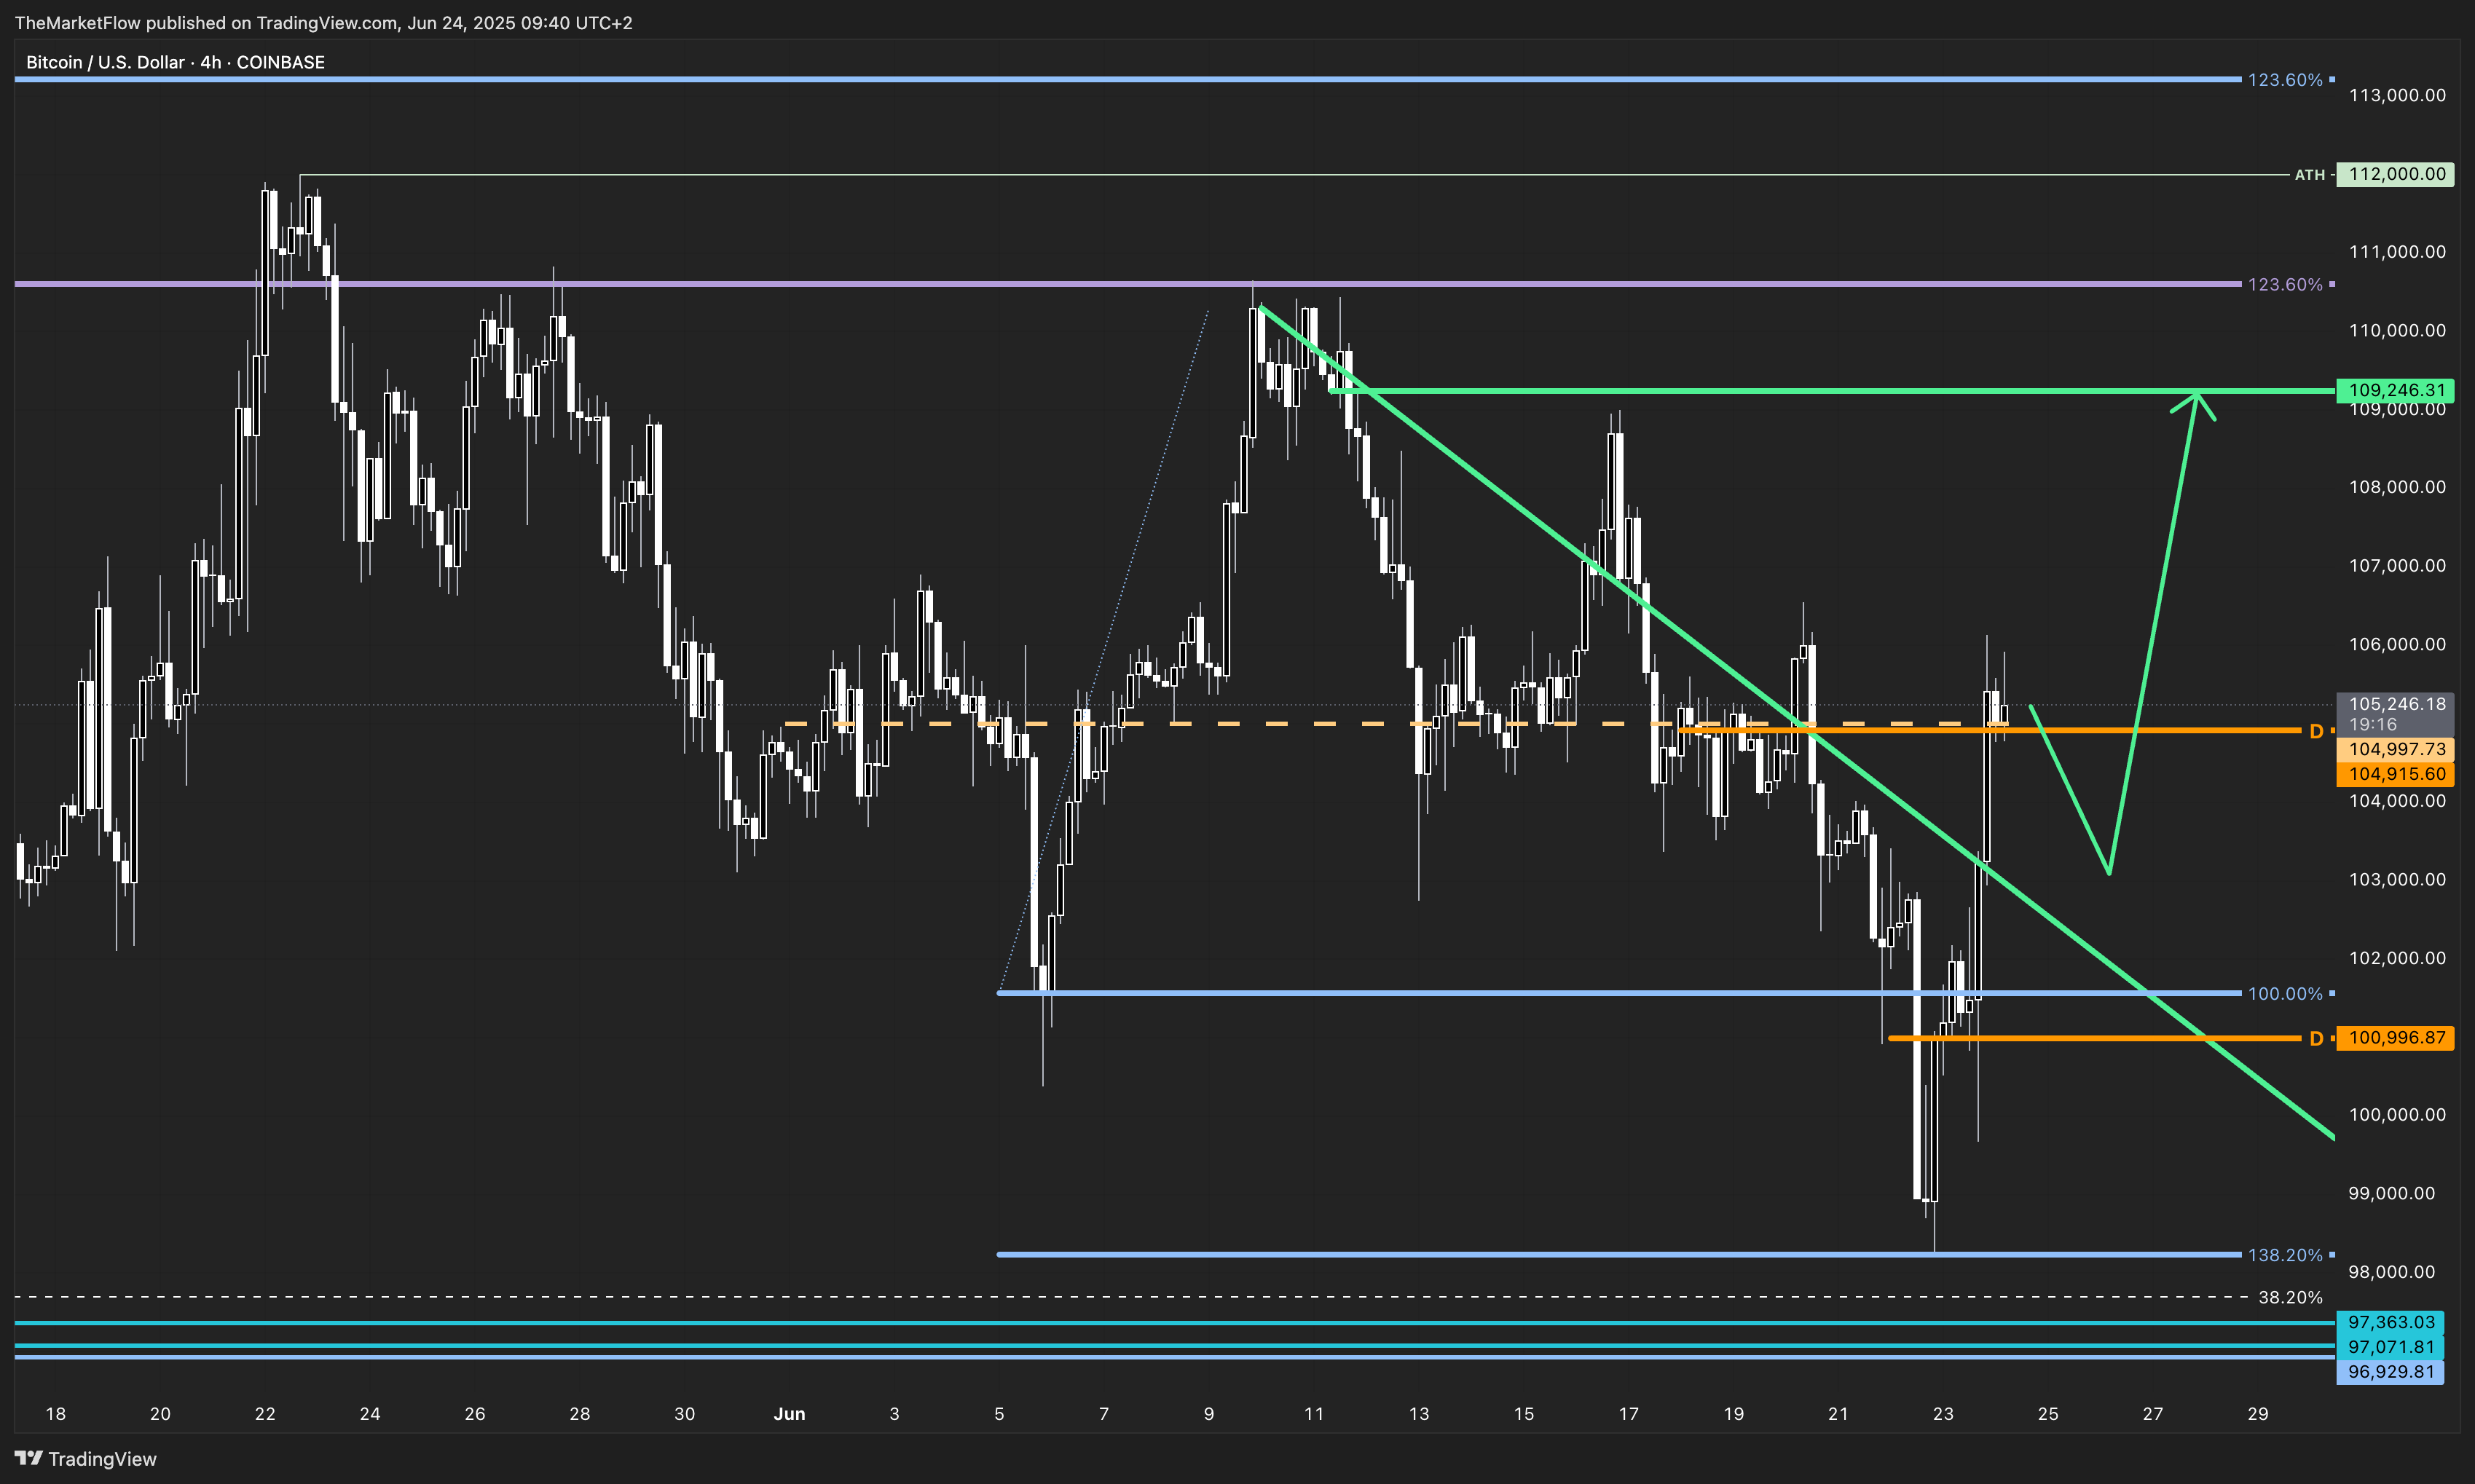
On the H4 chart, the short-term downtrend line (green) was breached, and price reclaimed the pivot zone around $104,915.60–$104,997.73. A clean breakdown level at $109,246.31 is now the immediate upside magnet. A pullback into the reclaimed daily pivot could provide a tactical re-entry opportunity. If that level holds, the trend could resume toward higher timeframe targets.
Key Levels
Long Trigger: H4 countertrend line break above ~$105,000
Orange Pivot Zone: $100,996.87 (daily) – must hold for bullish continuation
Target Zones
H4 Breakdown Target: $109,246.31
Weekly/ATH Target: $112,000
Extended Fibonacci Target: $113,000 (123.6% weekly)
Validity
As long as the market holds above $100,996.87 (daily pivot), the upside structure remains valid. A breakdown below this level would suggest the correction phase is resuming, invalidating the immediate bullish outlook.
Conclusion
Bitcoin has invalidated the short-term countertrend structure with a strong impulsive candle from a confluence Fibonacci zone. This sets the stage for a potential trend resumption, with a first target at $109,246.31. Sustained strength above the new pivot confirms the structure, while a drop back below $101K would reset the setup.
Actionable Insight
Watch for a pullback into $104,915.60–$104,997.73 or $100,996.87 to assess long entries. A clean break and hold above $109,246.31 could open the path toward all-time highs.
How are you interpreting this structure? Share your view in the comments—let’s compare frameworks.