Aluminum Futures | Weekly Expansion in Progress
Multi-timeframe bullish alignment extends the expansion phase toward the weekly 138.2% Fibonacci target.
The Market Flow | November 6 2025
Technical Overview
Instrument Note:
Analysis is based on the continuous Aluminum Futures (MCX) chart, with current structural reference taken from the front-month ALUMINIUMX2025 contract.
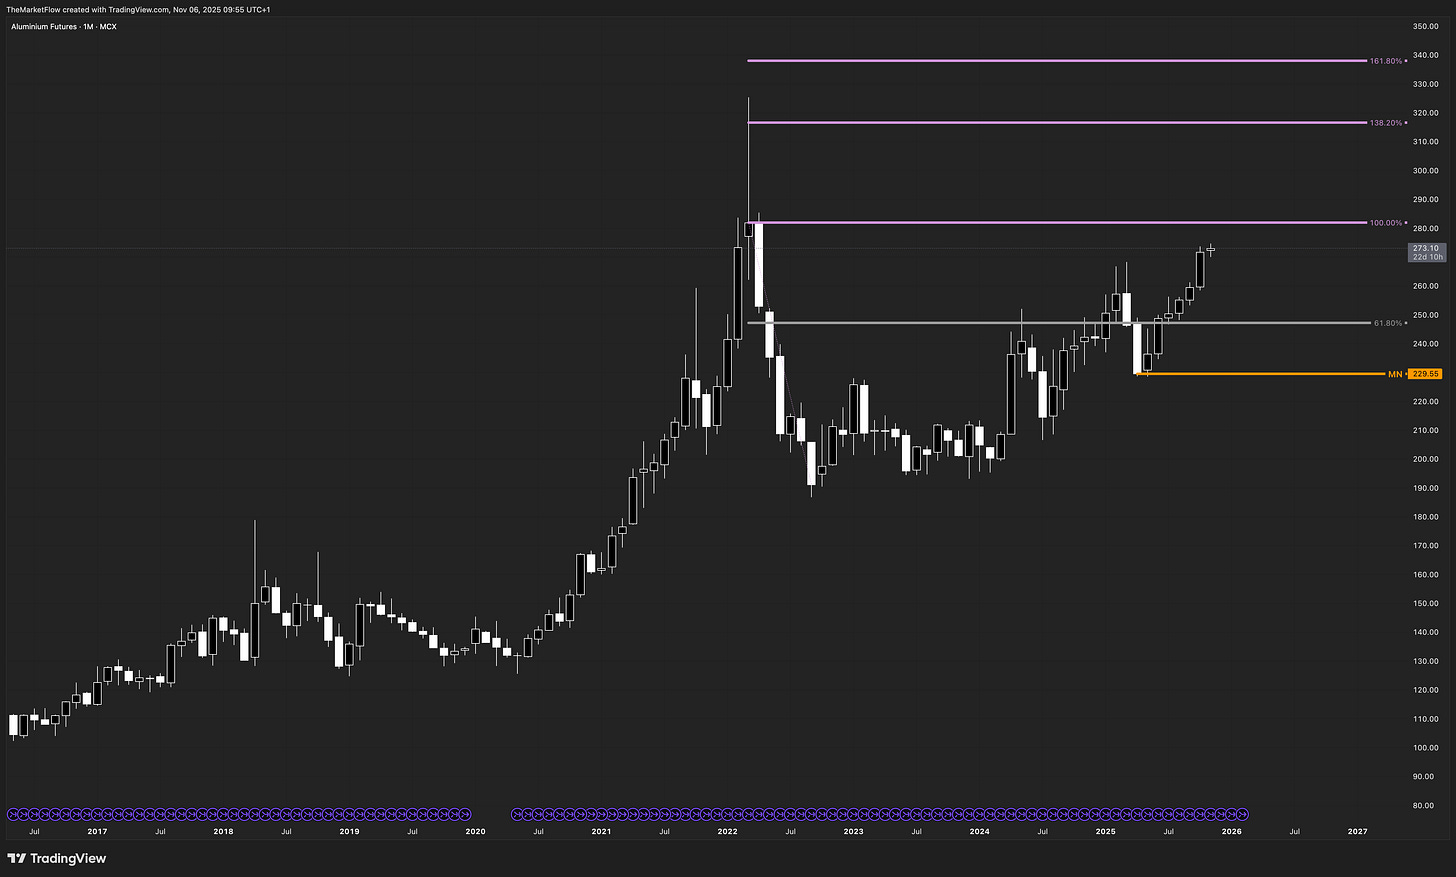
Monthly:
The monthly trend remains bullish, holding above the single active monthly pivot at 229.55. Structure confirms long-term expansion with steady upward momentum and no visible exhaustion. The higher timeframe remains the dominant driver of bias.
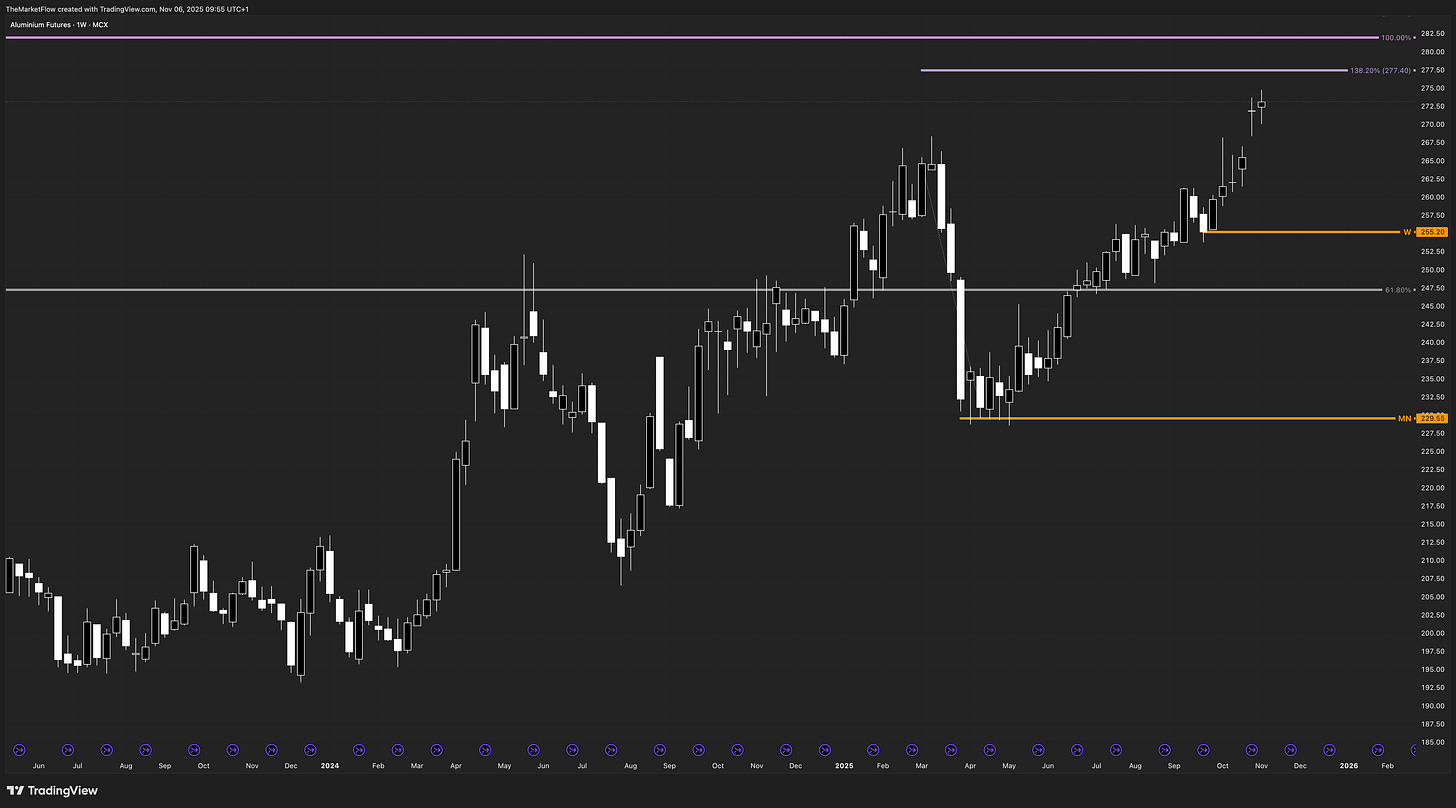
Weekly:
The weekly timeframe is in an active Expansion phase, advancing toward the 138.2% Fibonacci extension at 277.40. The weekly pivot 255.20 secures directional bias; price action remains decisively above it. A weekly close below 255.20 would mark early correction, though trend bias remains intact while that level holds.
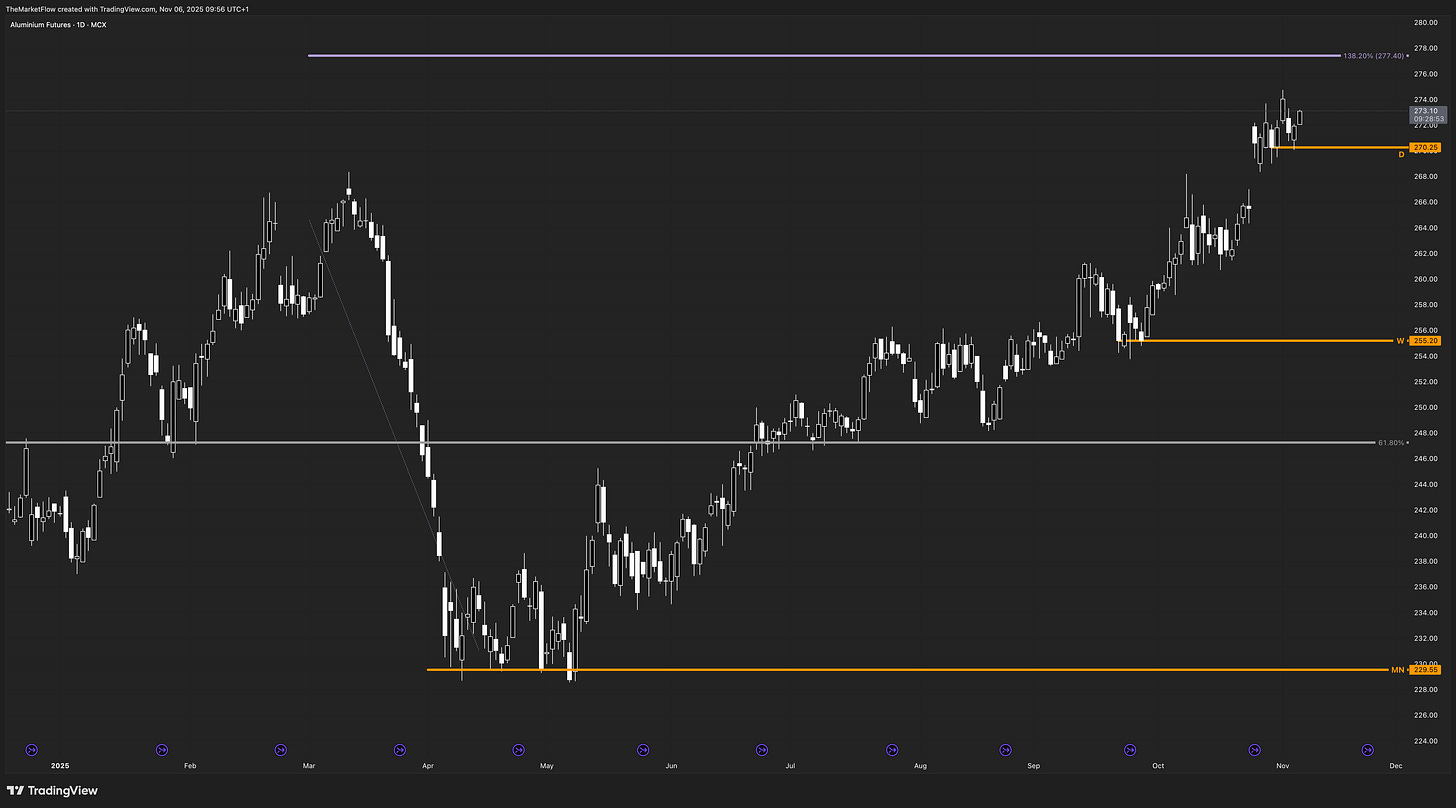
Daily:
Daily structure remains impulsive, preserving alignment with the higher timeframe. The daily pivot 270.25 defines invalidation — as long as daily waves remain upward, continuation toward higher-timeframe targets remains valid. Momentum is constructive while closes stay above this pivot.
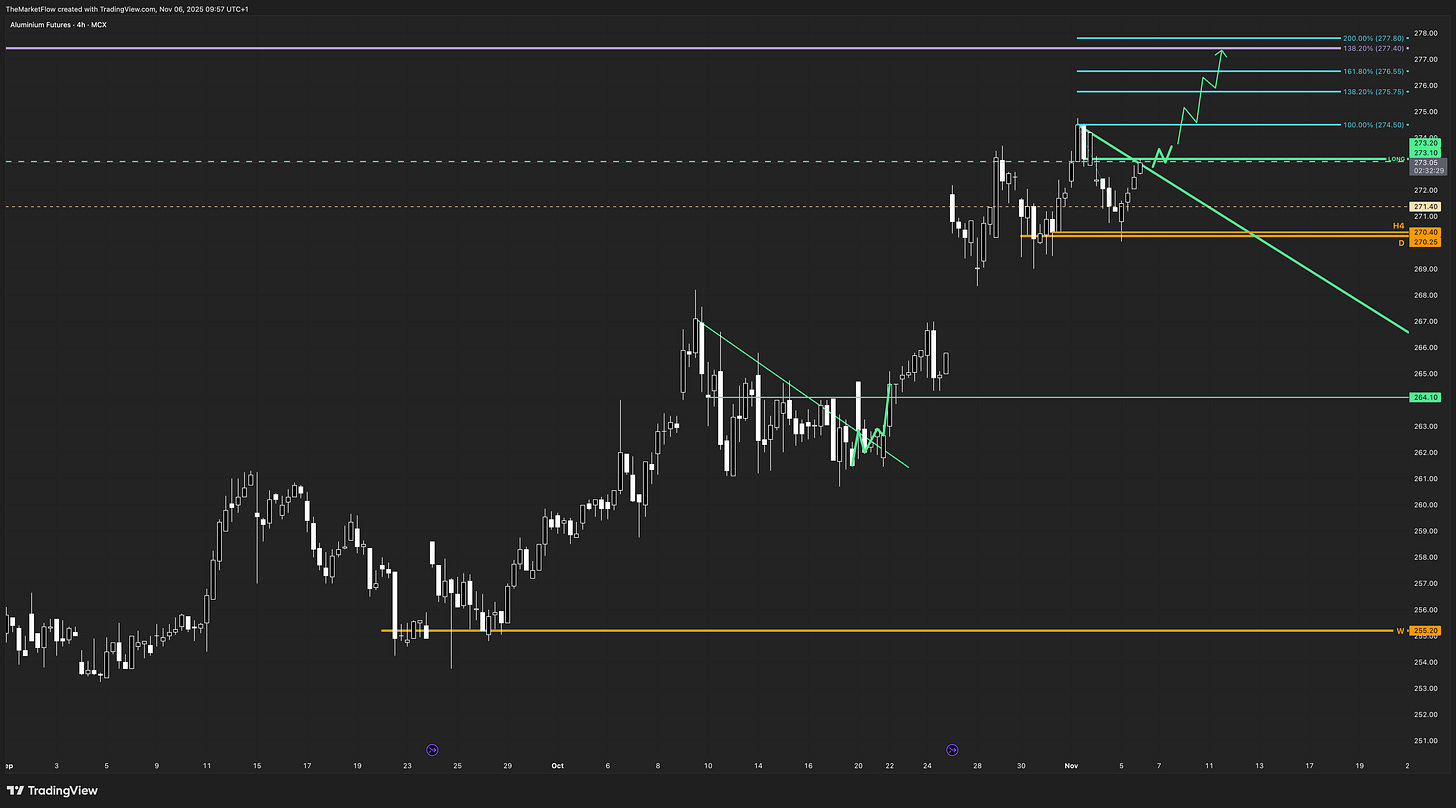
H4:
The H4 structure confirmed a clean countertrend break through the “LONG” level, initiating continuation. Price has reclaimed the green dashed VAH at 273.20, which acts as immediate micro support. The H4 Fibonacci targets define the path:
→ 271.40 (138.2%)
→ 272.55 (161.8%)
→ 275.50 (200.0%)
The final objective aligns with the weekly 138.2% target at 277.40, completing the expansion sequence.
Trade Structure & Levels
Bias: Long above 255.20 (Weekly pivot)
Phase: Expansion
Trigger: H4 countertrend break with waves above “LONG” level
Invalidation: Daily close below 270.25 (Daily pivot)
Path → 271.40 → 272.55 → 275.50 → 277.40
Risk & Event Context
Aluminum pricing remains sensitive to industrial demand, energy-cost shifts, and Chinese supply activity. Volatility may rise with LME inventory updates, macro data releases, and fluctuations in the USD, which often influence base-metal momentum.
Conclusion
All active timeframes confirm a bullish expansion structure supported by higher-timeframe pivots. With the monthly pivot 229.55, weekly pivot 255.20, and daily pivot 270.25 intact, continuation toward the 277.40 weekly 138.2% target remains the operative path. The H4 Fibonacci sequence frames short-term progression within this broader expansion.
This publication is provided for informational and educational purposes only and does not constitute investment advice, a solicitation, or a recommendation to buy or sell any security, derivative, or financial instrument. The analysis and opinions expressed reflect the author’s views at the time of writing and are subject to change without notice.
All information is derived from publicly available sources believed to be reliable, but accuracy and completeness are not guaranteed. Past performance is not indicative of future results, and no representation or warranty is made regarding future price behavior or outcomes.
Readers are solely responsible for their own investment decisions and should consult a qualified financial advisor before acting on any information contained herein.
The author and/or affiliates may hold, trade, or have a financial interest in the securities or instruments mentioned in this publication. Neither the author nor any associated party accepts liability for any direct or consequential loss arising from the use of this material.


